

Question: 3. This circle graph (pie chart) represents how Harriet spent $500,000. Examine this graph and then answer the questions on the ne Gifts 10%
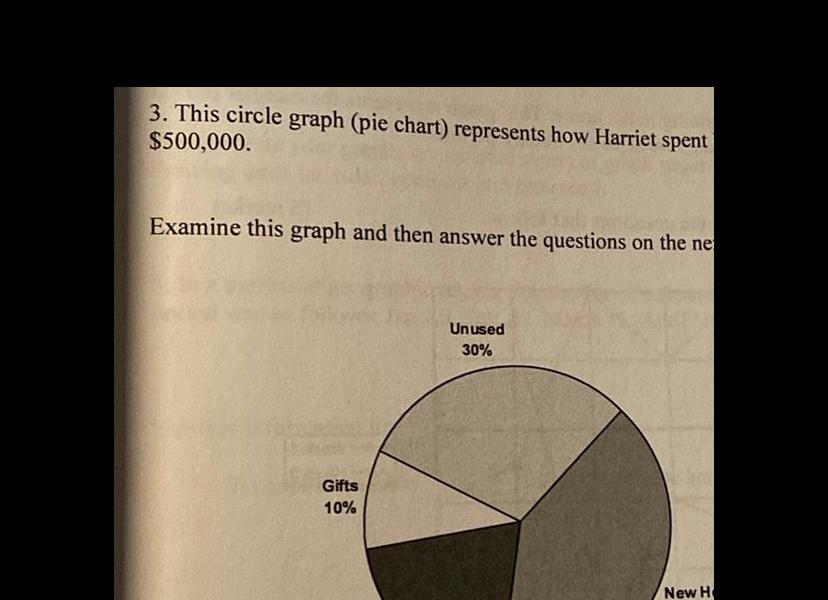
3. This circle graph (pie chart) represents how Harriet spent $500,000. Examine this graph and then answer the questions on the ne Gifts 10% Unused 30% New H
Step by Step Solution
There are 3 Steps involved in it
1 Expert Approved Answer
Step: 1 Unlock

Question Has Been Solved by an Expert!
Get step-by-step solutions from verified subject matter experts
Step: 2 Unlock
Step: 3 Unlock