Question: 3) This question will have you calculating 2 different EOQ and ROP values and interpreting the results. For both EOQ and ROP, give your final
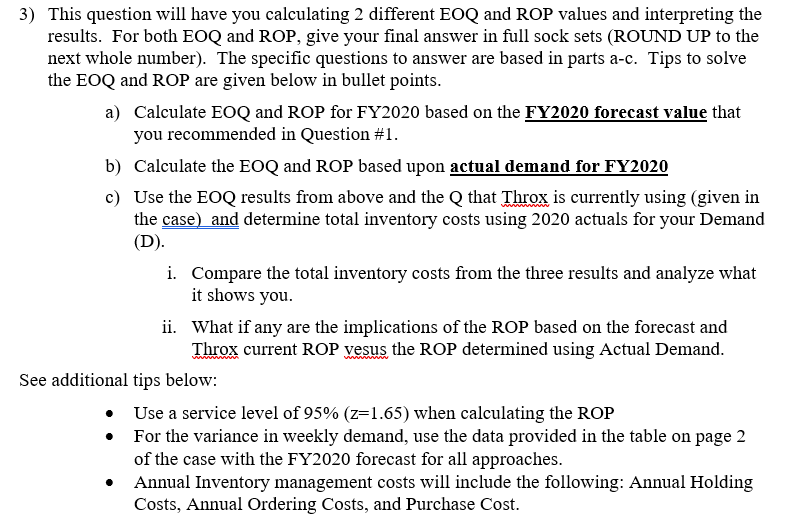
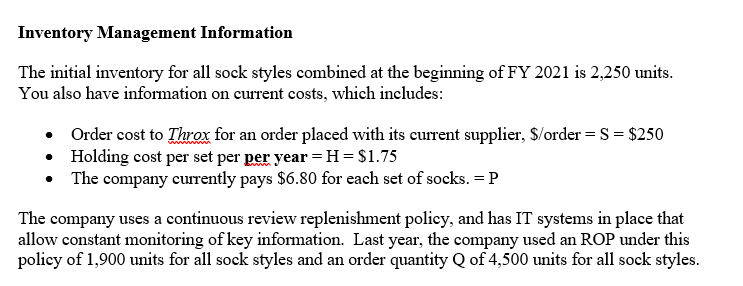
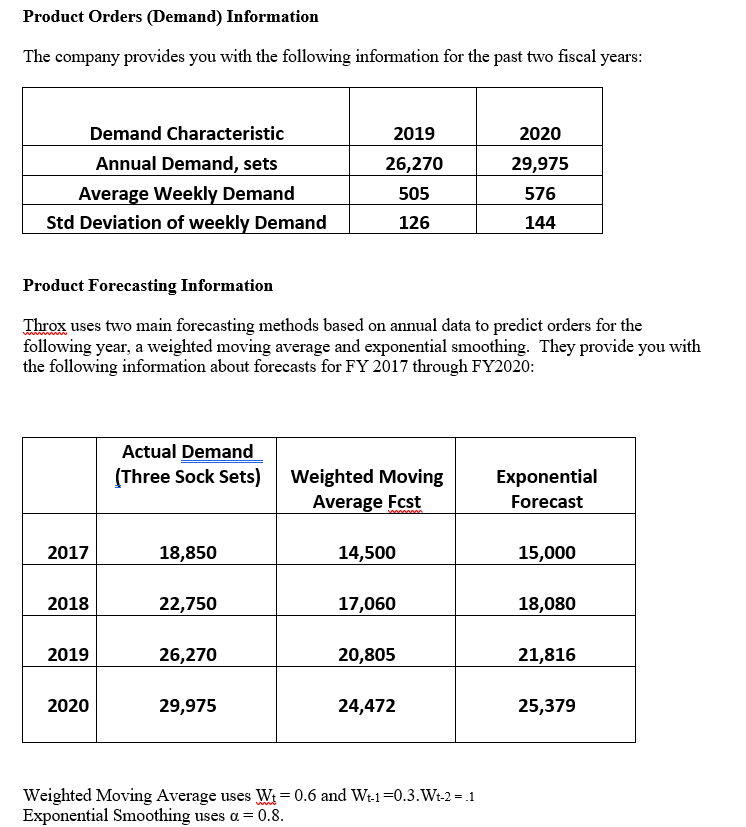
3) This question will have you calculating 2 different EOQ and ROP values and interpreting the results. For both EOQ and ROP, give your final answer in full sock sets (ROUND UP to the next whole number). The specific questions to answer are based in parts a-c. Tips to solve the EOQ and ROP are given below in bullet points. a) Calculate EOQ and ROP for FY2020 based on the FY2020 forecast value that you recommended in Question #1. b) Calculate the EOQ and ROP based upon actual demand for FY2020 c) Use the EOQ results from above and the Q that Throx is currently using (given in the case) and determine total inventory costs using 2020 actuals for your Demand (D). i. Compare the total inventory costs from the three results and analyze what it shows you. ii. What if any are the implications of the ROP based on the forecast and Throx current ROP vesus the ROP determined using Actual Demand. See additional tips below: Use a service level of 95% (z=1.65) when calculating the ROP For the variance in weekly demand, use the data provided in the table on page 2 of the case with the FY2020 forecast for all approaches. Annual Inventory management costs will include the following: Annual Holding Costs, Annual Ordering Costs, and Purchase Cost. . . Inventory Management Information The initial inventory for all sock styles combined at the beginning of FY 2021 is 2,250 units. You also have information on current costs, which includes: Order cost to Throx for an order placed with its current supplier, $/order = S = $250 Holding cost per set per per year=H=$1.75 The company currently pays $6.80 for each set of socks. = P The company uses a continuous review replenishment policy, and has IT systems in place that allow constant monitoring of key information. Last year, the company used an ROP under this policy of 1,900 units for all sock styles and an order quantity Q of 4,500 units for all sock styles. Product Orders (Demand) Information The company provides you with the following information for the past two fiscal years: 2019 2020 29,975 Demand Characteristic Annual Demand, sets Average Weekly Demand Std Deviation of weekly Demand 26,270 505 576 126 144 Product Forecasting Information Throx uses two main forecasting methods based on annual data to predict orders for the following year, a weighted moving average and exponential smoothing. They provide you with the following information about forecasts for FY 2017 through FY2020: Actual Demand (Three Sock Sets) Weighted Moving Average Fcst Exponential Forecast 2017 18,850 14,500 15,000 2018 22,750 17,060 18,080 2019 26,270 20,805 21,816 2020 29,975 24,472 25,379 = Weighted Moving Average uses W1=0.6 and Wt-1=0.3.Wt-2 = 1 Exponential Smoothing uses a = 0.8. 3) This question will have you calculating 2 different EOQ and ROP values and interpreting the results. For both EOQ and ROP, give your final answer in full sock sets (ROUND UP to the next whole number). The specific questions to answer are based in parts a-c. Tips to solve the EOQ and ROP are given below in bullet points. a) Calculate EOQ and ROP for FY2020 based on the FY2020 forecast value that you recommended in Question #1. b) Calculate the EOQ and ROP based upon actual demand for FY2020 c) Use the EOQ results from above and the Q that Throx is currently using (given in the case) and determine total inventory costs using 2020 actuals for your Demand (D). i. Compare the total inventory costs from the three results and analyze what it shows you. ii. What if any are the implications of the ROP based on the forecast and Throx current ROP vesus the ROP determined using Actual Demand. See additional tips below: Use a service level of 95% (z=1.65) when calculating the ROP For the variance in weekly demand, use the data provided in the table on page 2 of the case with the FY2020 forecast for all approaches. Annual Inventory management costs will include the following: Annual Holding Costs, Annual Ordering Costs, and Purchase Cost. . . Inventory Management Information The initial inventory for all sock styles combined at the beginning of FY 2021 is 2,250 units. You also have information on current costs, which includes: Order cost to Throx for an order placed with its current supplier, $/order = S = $250 Holding cost per set per per year=H=$1.75 The company currently pays $6.80 for each set of socks. = P The company uses a continuous review replenishment policy, and has IT systems in place that allow constant monitoring of key information. Last year, the company used an ROP under this policy of 1,900 units for all sock styles and an order quantity Q of 4,500 units for all sock styles. Product Orders (Demand) Information The company provides you with the following information for the past two fiscal years: 2019 2020 29,975 Demand Characteristic Annual Demand, sets Average Weekly Demand Std Deviation of weekly Demand 26,270 505 576 126 144 Product Forecasting Information Throx uses two main forecasting methods based on annual data to predict orders for the following year, a weighted moving average and exponential smoothing. They provide you with the following information about forecasts for FY 2017 through FY2020: Actual Demand (Three Sock Sets) Weighted Moving Average Fcst Exponential Forecast 2017 18,850 14,500 15,000 2018 22,750 17,060 18,080 2019 26,270 20,805 21,816 2020 29,975 24,472 25,379 = Weighted Moving Average uses W1=0.6 and Wt-1=0.3.Wt-2 = 1 Exponential Smoothing uses a = 0.8


