

Question: 3. To make the boxplots, press 2'1 , Y: which is [STAT PLOT]. Highlight Plotl and press ENTER. On the next screen highlight ON and
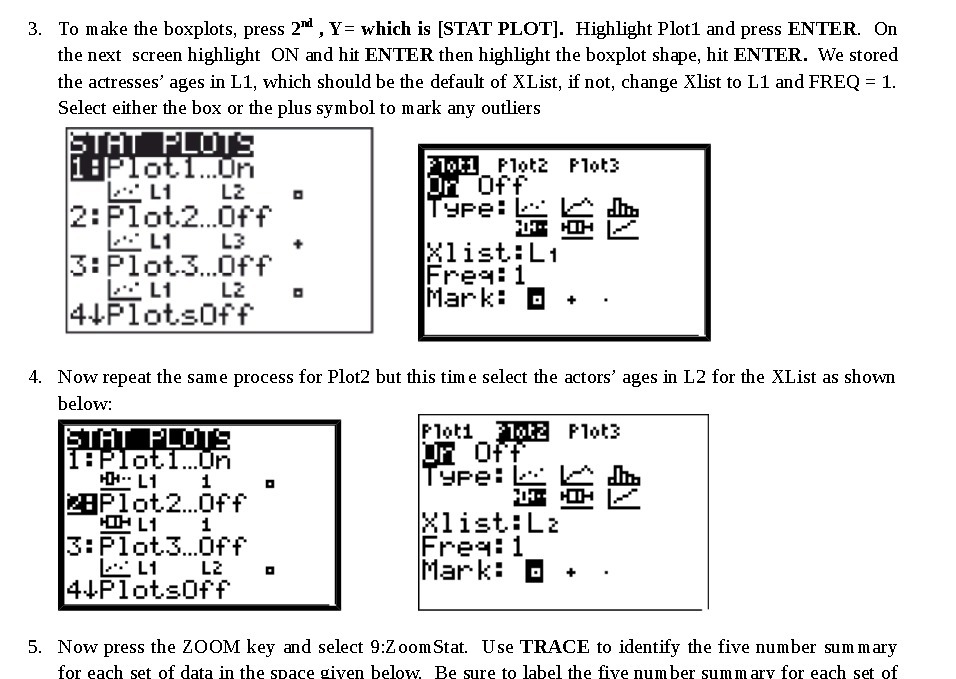
3. To make the boxplots, press 2'\"1 , Y: which is [STAT PLOT]. Highlight Plotl and press ENTER. On the next screen highlight ON and hit ENTER then highlight the boxplot shape, hit ENTER. We stored the actresses' ages in L1, which should be the default of XList, if not, change lest to L1 and FREQ = 1. Select either the box or the plus symbol to mark any outliers F'l :3 P1 '53 ml balms" For? l H Igu L: a . .. 2:Plot.2...f'+' PE" E E E EL'I L3 1- - . 33-333."? #33\" 4+P1otsorr mark\" '5' * 4. Now repeat the same process for P10t2 but this time select the actors' ages in L2 for the XList as shown below: 5. Now press the ZOOM key and select 9:2 oomStat. Use TRACE to identify the five number summary for each set of data in the space given below. Be sure to label the ve number summary for each set of
Step by Step Solution
There are 3 Steps involved in it

Get step-by-step solutions from verified subject matter experts