

Question: 3. Understanding why equilibrium prices and quantities change. Consider the graph below: Price Per unit PO Q1 Q2 Quantity A. When the demand curve shifts
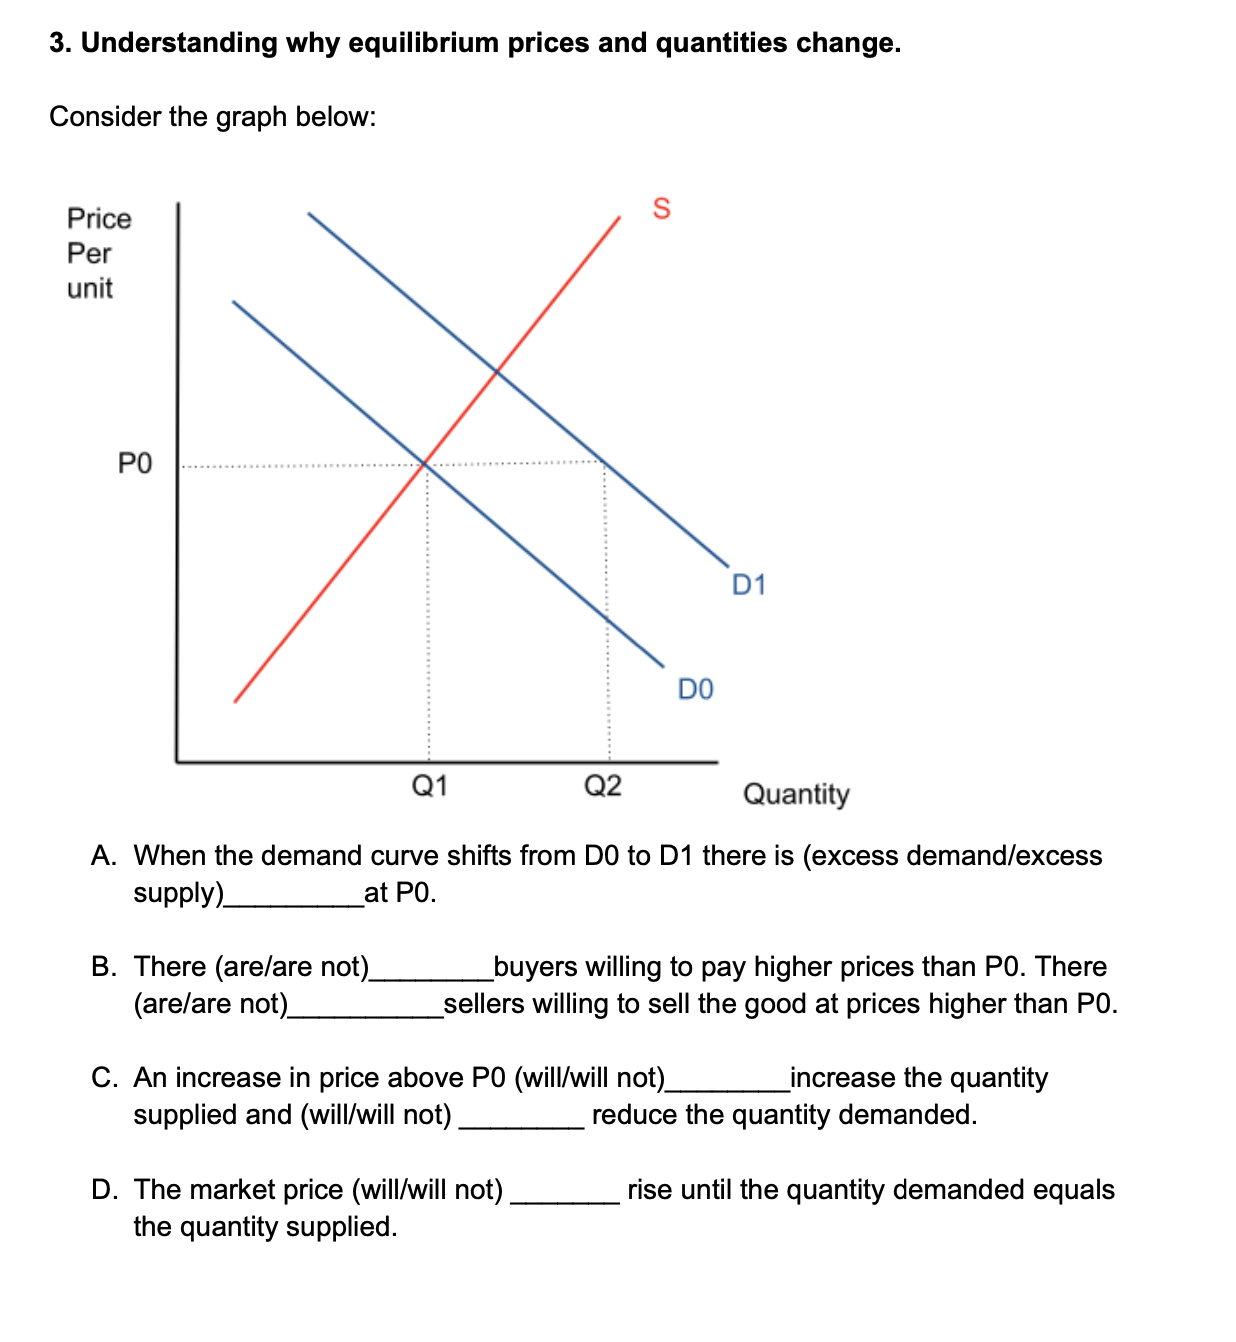

3. Understanding why equilibrium prices and quantities change. Consider the graph below: Price Per unit PO Q1 Q2 Quantity A. When the demand curve shifts from DO to D1 there is (excess demand/excess supply) at PO. B. There (are/are not) buyers willing to pay higher prices than PO. There (are/are not) sellers willing to sell the good at prices higher than PO. C. Anincrease in price above PO (will/will not) increase the quantity supplied and (will/will not) reduce the quantity demanded. D. The market price (will/will not) rise until the quantity demanded equals the quantity supplied
Step by Step Solution
There are 3 Steps involved in it
1 Expert Approved Answer
Step: 1 Unlock

Question Has Been Solved by an Expert!
Get step-by-step solutions from verified subject matter experts
Step: 2 Unlock
Step: 3 Unlock