

Question: 3. Use the data in the Data sheet and write your answers and calculations in sheet Q2. Consider the Yearly Amount Spent column. Often outliers
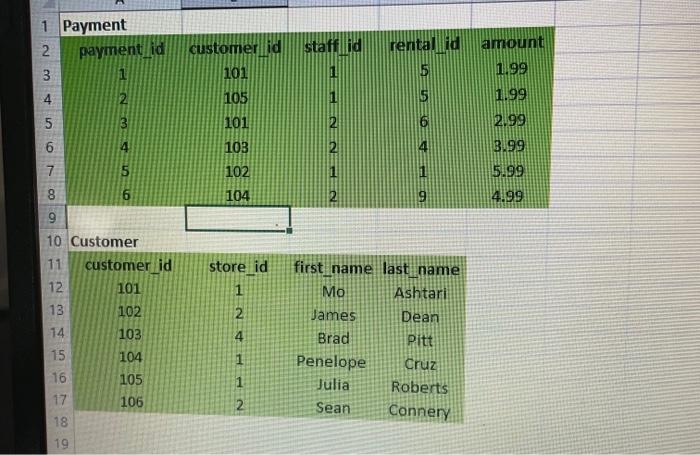
3. Use the data in the "Data" sheet and write your answers and calculations in sheet Q2. Consider the "Yearly Amount Spent" column. Often outliers in a dataset can be defined as are outside the +13 STD from the mean of the data. Use your knowledge on standardizing a distribution. Find the rows of data in the "Yearly Amount Spent" column that are considered to be "outliers". You may highlight them in yellow. How many outlier did you find? How many outliers did you find? (25 Points) * 5 3 9 6 \begin{tabular}{|c|c|c|c|c|c|} \hline \multicolumn{6}{|c|}{1 Payment } \\ \hline 2 & payment id & customer id & staff id & rental id & amount \\ \hline 3 & 1 & 101 & 1. & 5 & 1.99 \\ \hline 4 & 2 & 105 & 1. & 5 & 1.99 \\ \hline 5 & 3 & 101 & 2 & 6 & 2.99 \\ \hline 6 & 4 & 103 & 2 & 4 & 3.99 \\ \hline 7 & 5 & 102 & 1 & 1 & 5.99 \\ \hline 8 & 6 & 104 & 2 & 9 & 4.99 \\ \hline 9 & & & & & \\ \hline \multicolumn{6}{|c|}{10 Customer } \\ \hline 11 & customer id & store_id & first_name & last name & \\ \hline 12 & 101 & 1 & Mo & Ashtari & \\ \hline 13 & 102 & 2 & James & Dean & \\ \hline 1. & 103 & 4 & Brad & Pitt & \\ \hline 1 & 104 & 1 & Penelope & cruz & \\ \hline 1 & 105 & 1 & Julia & Roberts & \\ \hline & 106 & 2 & Sean & Connery & \\ \hline \end{tabular}
Step by Step Solution
There are 3 Steps involved in it

Get step-by-step solutions from verified subject matter experts