

Question: 3. Use the table below: For the categorical variables, the reference group that each of the other levels of thepredictor is being compared to
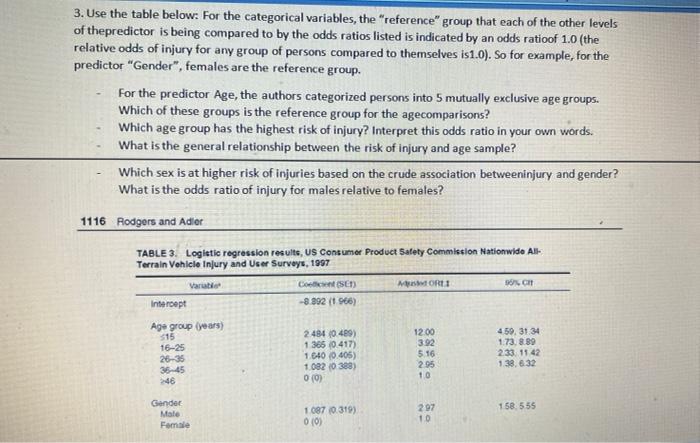
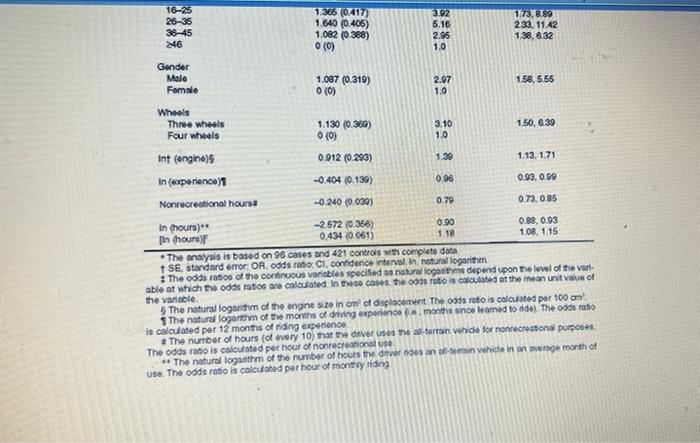
3. Use the table below: For the categorical variables, the "reference" group that each of the other levels of thepredictor is being compared to by the odds ratios listed is indicated by an odds ratioof 1.0 (the relative odds of injury for any group of persons compared to themselves is1.0). So for example, for the predictor "Gender", females are the reference group. For the predictor Age, the authors categorized persons into 5 mutually exclusive age groups. Which of these groups is the reference group for the agecomparisons? Which age group has the highest risk of injury? Interpret this odds ratio in your own words. What is the general relationship between the risk of injury and age sample? Which sex is at higher risk of injuries based on the crude association betweeninjury and gender? What is the odds ratio of injury for males relative to females? 1116 Rodgers and Adler TABLE 3. Logistic regression results, US Consumer Product Safety Commission Nationwide All- Terrain Vehicle Injury and User Surveys, 1997 Variable Intercept Coeficient (SET) -8.892 (1966) MORE 90% C Age group (years) 515 2.484 (0.489) 12.00 4.59, 31.34 16-25 1.365 (0.417) 3.92 1.73.8.89 26-35 1.640 (0.405) 5.16 2.33.11.42 36-45 1.082 (0.388) 2.95 1.38.6.32 246 0 (0) 1.0 Gender Male 1.087 (0.319) 297 1.58.5.55 Female 0 (0) 1.0
Step by Step Solution
There are 3 Steps involved in it

Get step-by-step solutions from verified subject matter experts