

Question: 3. Use the variance-covariance matrix, mean return vector, and sigma vector that you calculated in Question 2 for Google, Ford Motors, Goldman Sachs, Starbucks, General
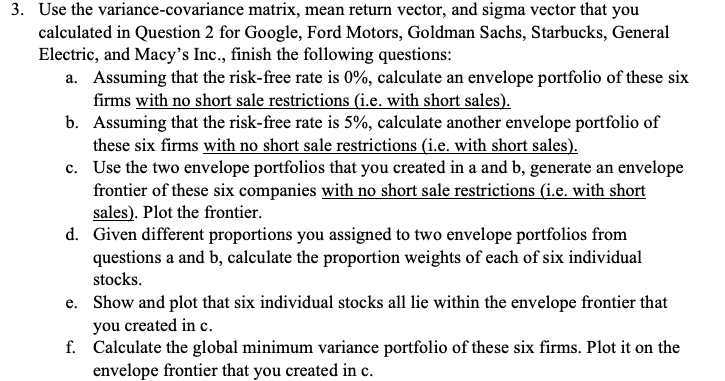
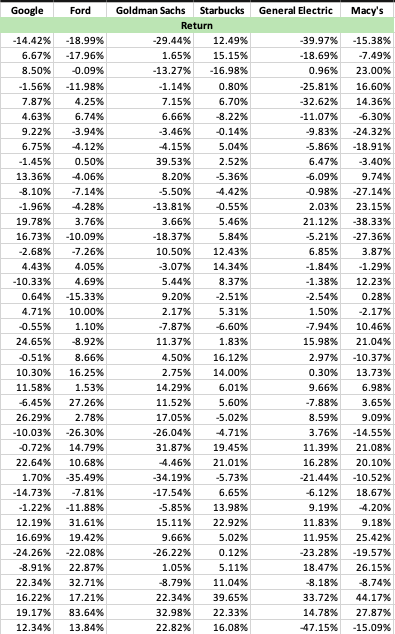
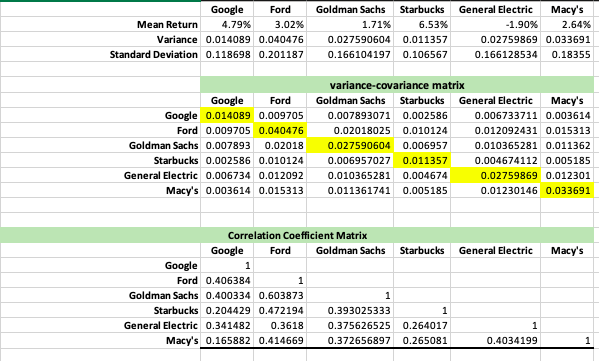
3. Use the variance-covariance matrix, mean return vector, and sigma vector that you calculated in Question 2 for Google, Ford Motors, Goldman Sachs, Starbucks, General Electric, and Macy's Inc., finish the following questions: a. Assuming that the risk-free rate is 0%, calculate an envelope portfolio of these six firms with no short sale restrictions (i.e. with short sales). b. Assuming that the risk-free rate is 5%, calculate another envelope portfolio of these six firms with no short sale restrictions (i.e. with short sales). c. Use the two envelope portfolios that you created in a and b, generate an envelope frontier of these six companies with no short sale restrictions (i.e. with short sales). Plot the frontier. d. Given different proportions you assigned to two envelope portfolios from questions a and b, calculate the proportion weights of each of six individual stocks. e. Show and plot that six individual stocks all lie within the envelope frontier that you created in c. f. Calculate the global minimum variance portfolio of these six firms. Plot it on the envelope frontier that you created in c. Google Ford General Electric Macy's DON -14.42% 6.67% 8.50% -1.56% 7.87% 4.63% 9.22% 6.75% -1.45% 13.36% 8.10% -1.96% 19.78% 16.73% -2.68% 4.43% -10.33% 0.64% 4.71% 0.55% 24.65% -0.51% 10.30% 11.58% -6.45% 26.29% -10.03% 0.72% 22.64% 1.70% -14.73% -1.22% 12.19% 16.69% -24.26% -8.91% 22.34% 16.22% 19.17% 12.34% -18.99% -17.96% 0.09% -11.98% 4.25% 6.74% -3.94% 4.12% 0.50% 4.06% -7.14% 4.28% 3.76% -10.09% -7.26% 4.05% 4.69% -15.33% 10.00% 1.10% 8.92% 8.66% 16.25% 1.53% 27.26% 2.78% 26.30% 14.79% 10.68% -35.49% 7.81% 11.88% 31.61% 19.42% -22.08% 22.87% 32.71% 17.21% 83.64% 13.84% Goldman Sachs Starbucks Return -29.44% 12.49% 1.65% 15.15% -13.27% -16.98% -1.14% 0.80% 7.15% 6.70% 6.66% -8.22% 3.46% 0.14% 4.15% 5.04% 39.53% 2.52% 8.20% -5.36% -5.50% 4.42% -13.81% -0.55% 3.66% 5.46% -18.37% 5.84% 10.50% 12.43% -3.07% 14.34% 5.44% 8.37% 9.20% -2.51% 2.17% 5.31% -7.87% -6.60% 11.37% 1.83% 4.50% 16.12% 2.75% 14.00% 14.29% 6.01% 11.52% 5.60% 17.05% -5.02% -26.04% 4.71% 31.87% 19.45% 4.46% 21.01% -34.19% -5.73% -17.54% 6.65% -5.85% 13.98% 15.11% 22.92% 9.66% 5.02% -26.22% 0.12% 1.05% 5.11% -8.79% 11.04% 22.34% 39.65% 32.98% 22.33% 22.82% 16.08% -39.97% -18.69% 0.96% -25.81% -32.62% -11.07% -9.83% -5.86% 6.47% 6.09% -0.98% 2.03% 21.12% -5.21% 6.85% -1.84% -1.38% -2.54% 1.50% -7.94% 15.98% 2.97% 0.30% 9.66% -7.88% 8.59% 3.76% 11.39% 16.28% -21.44% 6.12% 9.19% 11.83% 11.95% -23.28% 18.47% -8.18% 33.72% 14.78% -47.15% -15.38% -7.49% 23.00% 16.60% 14.36% 6.30% -24.32% 18.91% -3.40% 9.74% -27.14% 23.15% -38.33% 27.36% 3.87% -1.29% 12.23% 0.28% -2.17% 10.46% 21.04% -10.37% 13.73% 6.98% 3.65% 9.09% -14.55% 21.08% 20.10% -10.52% 18.67% 4.20% 9.18% 25.42% -19.57% 26.15% -8.74% 44.17% 27.87% -15.09% Google Ford Mean Return 4.79% 3.02% Variance 0.014089 0.040476 Standard Deviation 0.118698 0.201187 Goldman Sachs Starbucks 1.71% 6.53% 0.027590604 0.011357 0.166104197 0.106567 General Electric Macy's -1.90% 2.64% 0.02759869 0.033691 0.166128534 0.18355 Google Ford Google 0.014089 0.009705 Ford 0.009705 0.040476 Goldman Sachs 0.007893 0.02018 Starbucks 0.002586 0.010124 General Electric 0.006734 0.012092 Macy's 0.003614 0.015313 variance-covariance matrix Goldman Sachs Starbucks General Electric Macy's 0.007893071 0.002586 0.006733711 0.003614 0.02018025 0.010124 0.012092431 0.015313 0.027590604 0.006957 0.010365281 0.011362 0.006957027 0.011357 0.004674112 0.005185 0.010365281 0.004674 0.02759869 0.012301 0.011361741 0.005185 0.01230146 0.033691 Starbucks General Electric Macy's Correlation Coefficient Matrix Google Ford Goldman Sachs Google 1 Ford 0.406384 1 Goldman Sachs 0.400334 0.603873 Starbucks 0.204429 0.472194 0.393025333 General Electric 0.341482 0.3618 0.375626525 Macy's 0.165882 0.414669 0.372656897 0.264017 0.265081 0.4034199 3. Use the variance-covariance matrix, mean return vector, and sigma vector that you calculated in Question 2 for Google, Ford Motors, Goldman Sachs, Starbucks, General Electric, and Macy's Inc., finish the following questions: a. Assuming that the risk-free rate is 0%, calculate an envelope portfolio of these six firms with no short sale restrictions (i.e. with short sales). b. Assuming that the risk-free rate is 5%, calculate another envelope portfolio of these six firms with no short sale restrictions (i.e. with short sales). c. Use the two envelope portfolios that you created in a and b, generate an envelope frontier of these six companies with no short sale restrictions (i.e. with short sales). Plot the frontier. d. Given different proportions you assigned to two envelope portfolios from questions a and b, calculate the proportion weights of each of six individual stocks. e. Show and plot that six individual stocks all lie within the envelope frontier that you created in c. f. Calculate the global minimum variance portfolio of these six firms. Plot it on the envelope frontier that you created in c. Google Ford General Electric Macy's DON -14.42% 6.67% 8.50% -1.56% 7.87% 4.63% 9.22% 6.75% -1.45% 13.36% 8.10% -1.96% 19.78% 16.73% -2.68% 4.43% -10.33% 0.64% 4.71% 0.55% 24.65% -0.51% 10.30% 11.58% -6.45% 26.29% -10.03% 0.72% 22.64% 1.70% -14.73% -1.22% 12.19% 16.69% -24.26% -8.91% 22.34% 16.22% 19.17% 12.34% -18.99% -17.96% 0.09% -11.98% 4.25% 6.74% -3.94% 4.12% 0.50% 4.06% -7.14% 4.28% 3.76% -10.09% -7.26% 4.05% 4.69% -15.33% 10.00% 1.10% 8.92% 8.66% 16.25% 1.53% 27.26% 2.78% 26.30% 14.79% 10.68% -35.49% 7.81% 11.88% 31.61% 19.42% -22.08% 22.87% 32.71% 17.21% 83.64% 13.84% Goldman Sachs Starbucks Return -29.44% 12.49% 1.65% 15.15% -13.27% -16.98% -1.14% 0.80% 7.15% 6.70% 6.66% -8.22% 3.46% 0.14% 4.15% 5.04% 39.53% 2.52% 8.20% -5.36% -5.50% 4.42% -13.81% -0.55% 3.66% 5.46% -18.37% 5.84% 10.50% 12.43% -3.07% 14.34% 5.44% 8.37% 9.20% -2.51% 2.17% 5.31% -7.87% -6.60% 11.37% 1.83% 4.50% 16.12% 2.75% 14.00% 14.29% 6.01% 11.52% 5.60% 17.05% -5.02% -26.04% 4.71% 31.87% 19.45% 4.46% 21.01% -34.19% -5.73% -17.54% 6.65% -5.85% 13.98% 15.11% 22.92% 9.66% 5.02% -26.22% 0.12% 1.05% 5.11% -8.79% 11.04% 22.34% 39.65% 32.98% 22.33% 22.82% 16.08% -39.97% -18.69% 0.96% -25.81% -32.62% -11.07% -9.83% -5.86% 6.47% 6.09% -0.98% 2.03% 21.12% -5.21% 6.85% -1.84% -1.38% -2.54% 1.50% -7.94% 15.98% 2.97% 0.30% 9.66% -7.88% 8.59% 3.76% 11.39% 16.28% -21.44% 6.12% 9.19% 11.83% 11.95% -23.28% 18.47% -8.18% 33.72% 14.78% -47.15% -15.38% -7.49% 23.00% 16.60% 14.36% 6.30% -24.32% 18.91% -3.40% 9.74% -27.14% 23.15% -38.33% 27.36% 3.87% -1.29% 12.23% 0.28% -2.17% 10.46% 21.04% -10.37% 13.73% 6.98% 3.65% 9.09% -14.55% 21.08% 20.10% -10.52% 18.67% 4.20% 9.18% 25.42% -19.57% 26.15% -8.74% 44.17% 27.87% -15.09% Google Ford Mean Return 4.79% 3.02% Variance 0.014089 0.040476 Standard Deviation 0.118698 0.201187 Goldman Sachs Starbucks 1.71% 6.53% 0.027590604 0.011357 0.166104197 0.106567 General Electric Macy's -1.90% 2.64% 0.02759869 0.033691 0.166128534 0.18355 Google Ford Google 0.014089 0.009705 Ford 0.009705 0.040476 Goldman Sachs 0.007893 0.02018 Starbucks 0.002586 0.010124 General Electric 0.006734 0.012092 Macy's 0.003614 0.015313 variance-covariance matrix Goldman Sachs Starbucks General Electric Macy's 0.007893071 0.002586 0.006733711 0.003614 0.02018025 0.010124 0.012092431 0.015313 0.027590604 0.006957 0.010365281 0.011362 0.006957027 0.011357 0.004674112 0.005185 0.010365281 0.004674 0.02759869 0.012301 0.011361741 0.005185 0.01230146 0.033691 Starbucks General Electric Macy's Correlation Coefficient Matrix Google Ford Goldman Sachs Google 1 Ford 0.406384 1 Goldman Sachs 0.400334 0.603873 Starbucks 0.204429 0.472194 0.393025333 General Electric 0.341482 0.3618 0.375626525 Macy's 0.165882 0.414669 0.372656897 0.264017 0.265081 0.4034199
Step by Step Solution
There are 3 Steps involved in it

Get step-by-step solutions from verified subject matter experts