

Question: 3. Using his data on annual squirrel population in a park, Noj found the following information: 25th percentile: 12 50th percentile: 15 75th percentile:
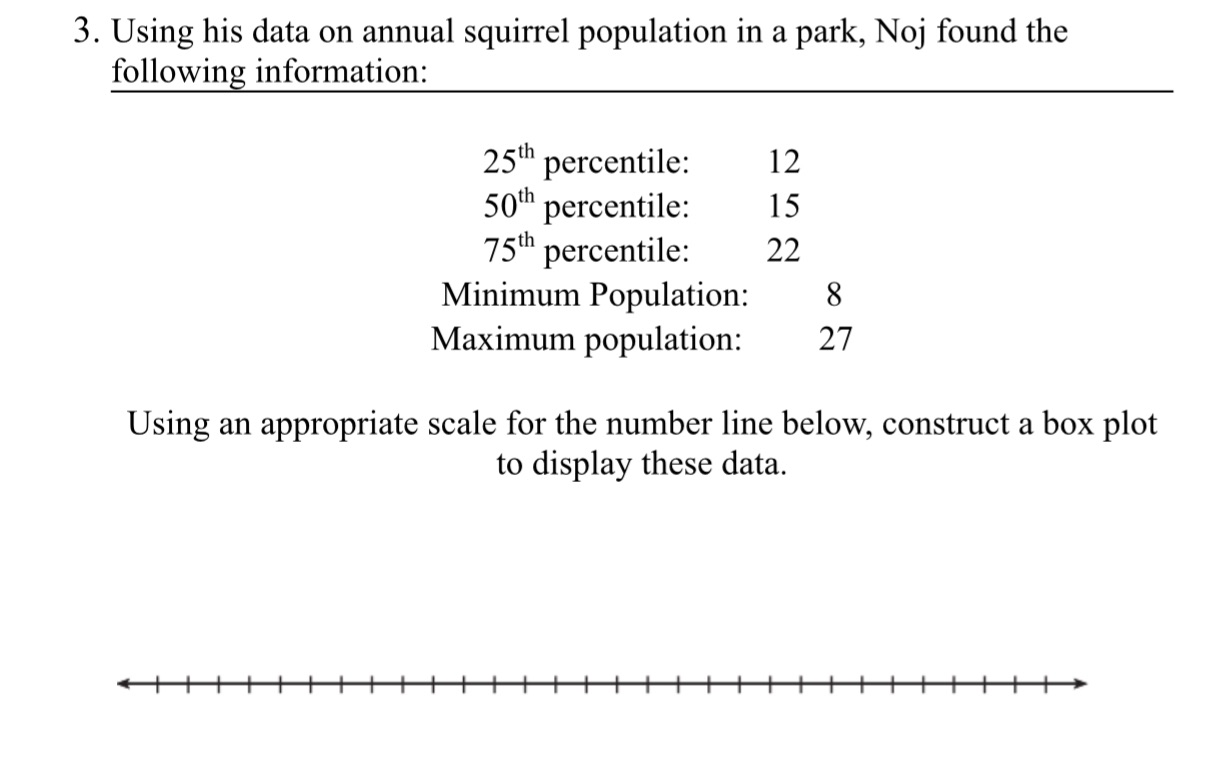
3. Using his data on annual squirrel population in a park, Noj found the following information: 25th percentile: 12 50th percentile: 15 75th percentile: 22 Minimum Population: 8 27 Maximum population: Using an appropriate scale for the number line below, construct a box plot to display these data.
Step by Step Solution
There are 3 Steps involved in it
1 Expert Approved Answer
Step: 1 Unlock

Question Has Been Solved by an Expert!
Get step-by-step solutions from verified subject matter experts
Step: 2 Unlock
Step: 3 Unlock