

Question: 3. Using NCHRP Report #365's Cross Classification methodology determine the number of Home-based Work (HBW), Home-based Other (HBO), and Non-Home Based (NHB) trips in each
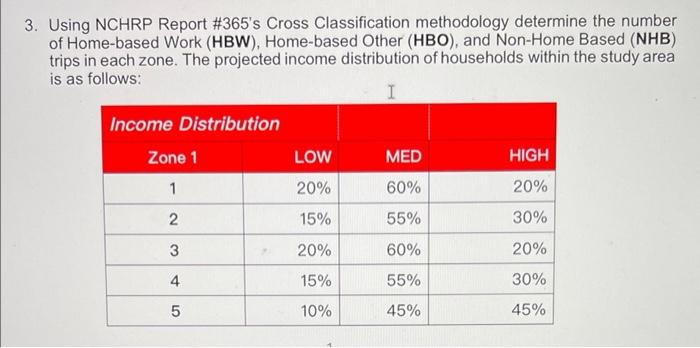
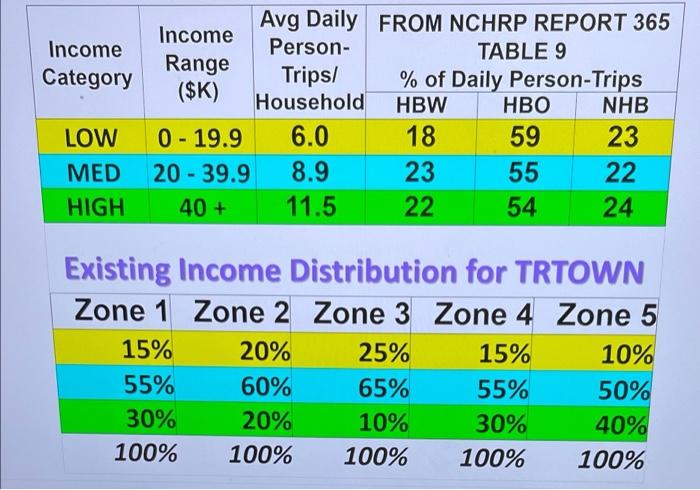
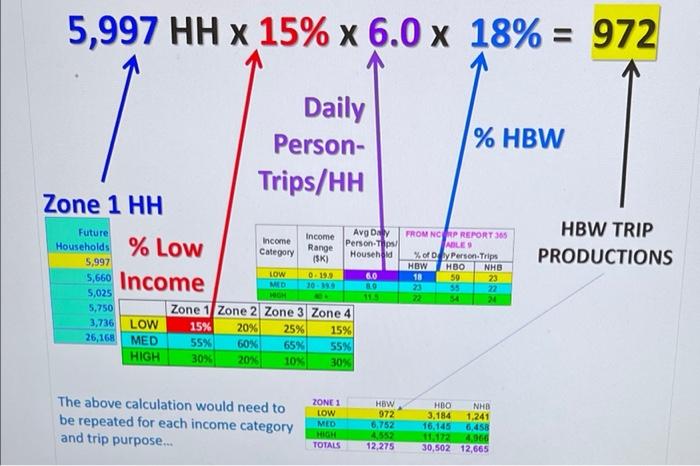
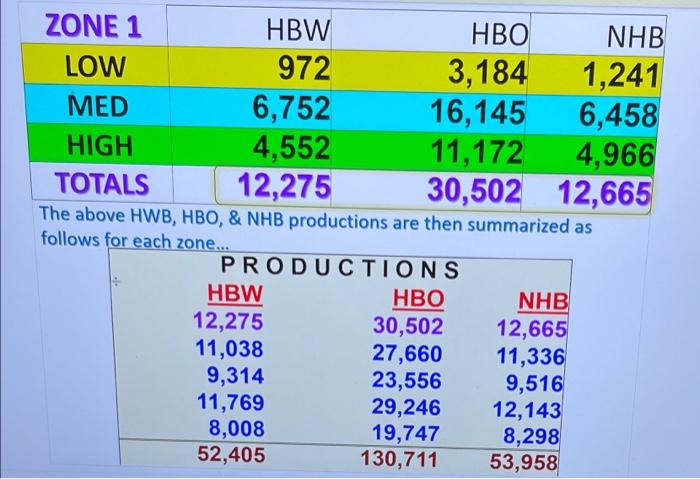
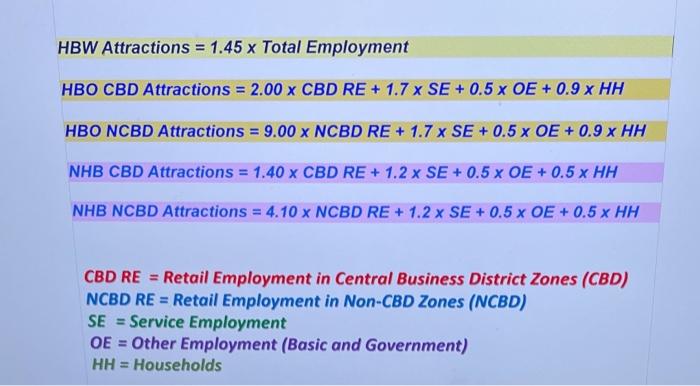
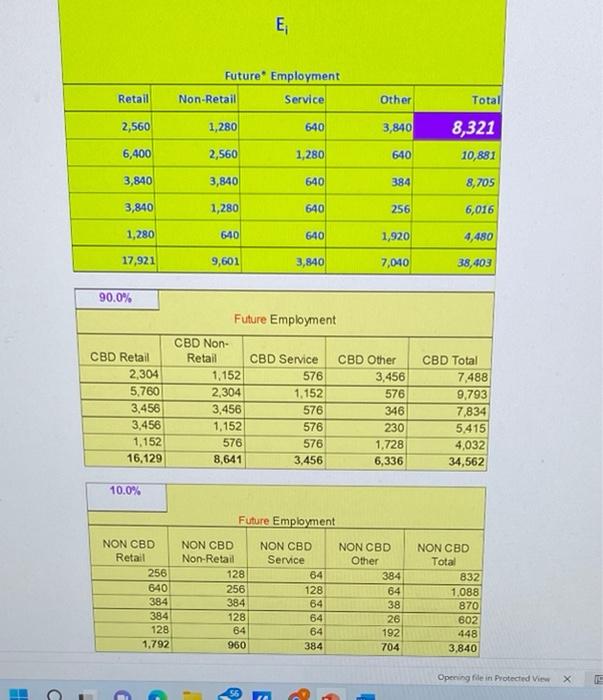
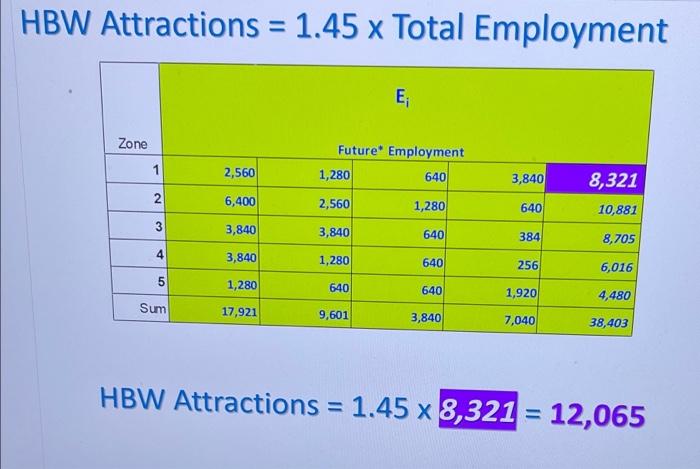
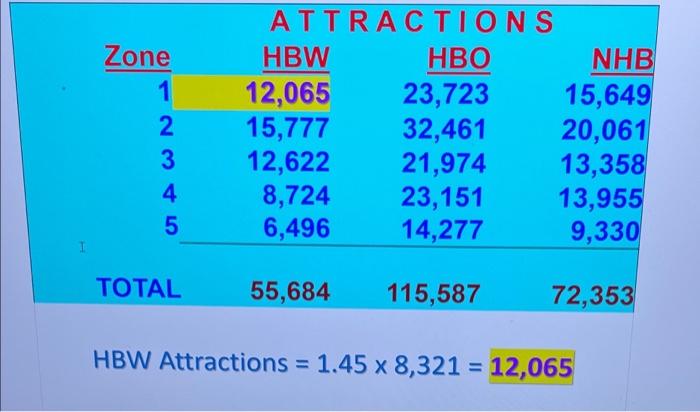
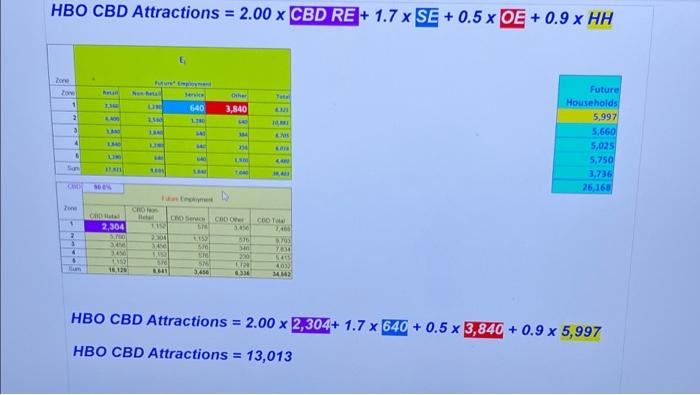
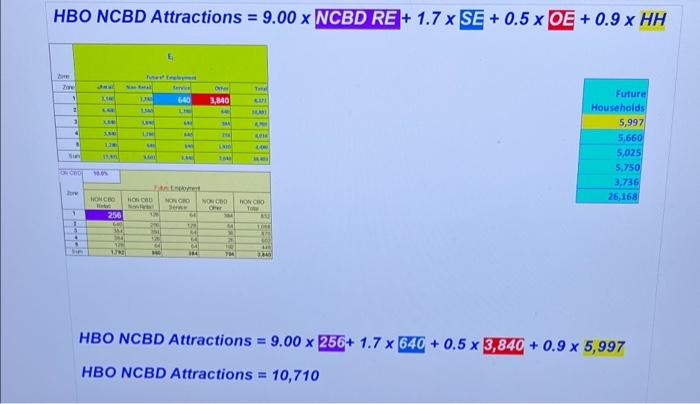
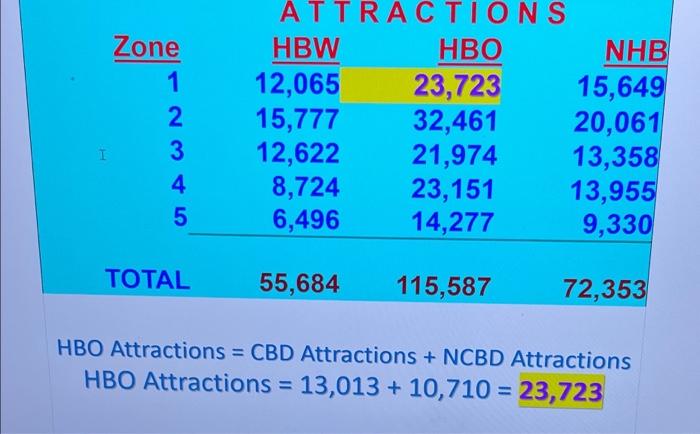
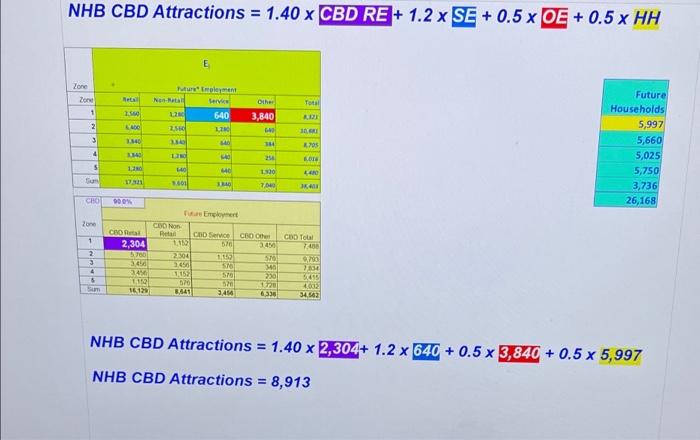
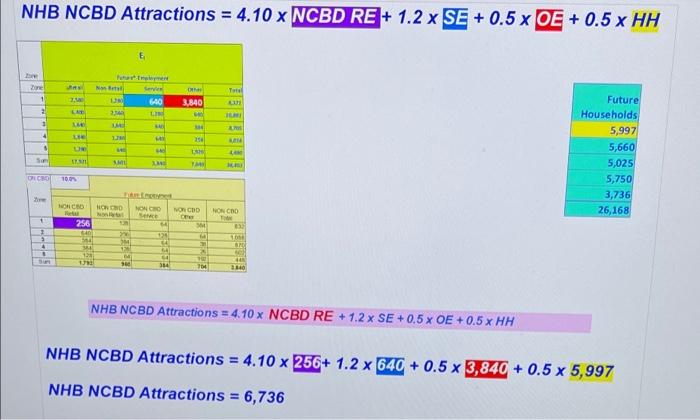
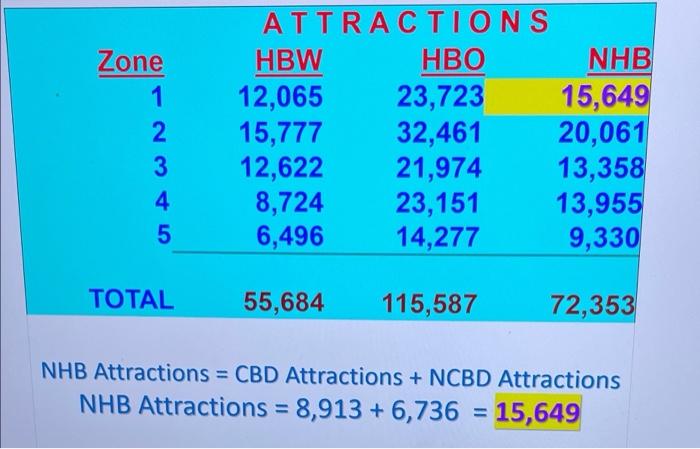
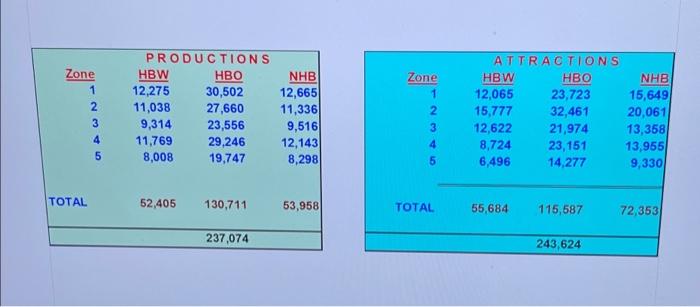
3. Using NCHRP Report #365's Cross Classification methodology determine the number of Home-based Work (HBW), Home-based Other (HBO), and Non-Home Based (NHB) trips in each zone. The projected income distribution of households within the study area is as follows: I Income Distribution Zone 1 LOW MED HIGH 1 20% 60% 20% 2 2 15% 55% 30% 3 20% 60% 20% 4 15% 55% 30% 5 10% 45% 45% Income Category Avg Daily FROM NCHRP REPORT 365 Income Person- TABLE 9 Range Trips/ ($K) % of Daily Person-Trips Household HBW HBO NHB 0 - 19.9 6.0 18 59 23 20 - 39.9 8.9 23 55 22 40 + 11.5 22 54 24 LOW MED HIGH Existing Income Distribution for TRTOWN Zone 1 Zone 2 Zone 3 Zone 4 Zone 5 15% 20% 25% 15% 10% 55% 60% 65% 55% 50% 30% 20% 10% 30% 40% 100% 100% 100% 100% 100% 5,997 HH X 15% x 6.0 x 18% = 972 Daily Person- Trips/HH % HBW Zone 1 HH Households % Low HBW TRIP PRODUCTIONS Future Income Avg DAY Income Person.Top Category Range (SK) Household 5,997 LOW 0199 6.0 5,660 Income MED 30 5,025 HOH 5,750 Zone 1 Zone 2 Zone 3 Zone 4 3,736 LOW 15% 20% 25% 15% 26,168 MED 55% 60% 65% 55% HIGH 30% 20% 10% 30% FROM NCRP REPORT 305 ADLE9 % of by Person Trips HOW HBO NHB 18 59 23 23 55 22 54 24 The above calculation would need to be repeated for each income category and trip purpose... ZONE 1 LOW MED HIGH TOTALS HEW 972 6,752 4,552 12,275 HBO NHD 3,184 1,241 16,145 6,458 11.172 4.066 30,502 12,665 ZONE 1 HBW HBO NHB LOW 972 3,184 1,241 MED 6,752 16,145 6,458 HIGH 4,552 11,172 4,966 TOTALS 12,275 30,502 12,665 The above HWB, HBO, & NHB productions are then summarized as follows for each zone... PRODUCTIONS HBW HBO NHB 12,275 30,502 12,665 11,038 27,660 11,336 9,314 23,556 9,516 11,769 29,246 12,143 8,008 19,747 8,298 52,405 130,711 53,958 HBW Attractions = 1.45 x Total Employment HBO CBD Attractions = 2.00 X CBD RE + 1.7 x SE + 0.5 x OE +0.9 x HH HBO NCBD Attractions = 9.00 x NCBD RE + 1.7 x SE +0.5 x OE +0.9 x HH NHB CBD Attractions = 1.40 X CBD RE + 1.2 x SE + 0.5 x OE + 0.5 x HH NHB NCBD Attractions = 4.10 x NCBD RE + 1.2 x SE + 0.5 x OE + 0.5 x HH CBD RE = Retail Employment in Central Business District Zones (CBD) NCBD RE = Retail Employment in Non-CBD Zones (NCBD) SE = Service Employment OE = Other Employment (Basic and Government) HH = Households E Future Employment Retail Non-Retail Service Other Total 2,560 1,280 640 3,840 8,321 10,881 6,400 2,560 1,280 640 3,840 3,840 640 384 8,705 3,840 1,280 640 256 6,016 1,280 640 640 1,920 4,480 17,921 9,601 3,840 7,040 38,403 90.0% CBD Retail 2,304 5.760 3.456 3,456 1.152 16.129 Future Employment CBD Non- Retail CBD Service CBD Other 1,152 576 3,456 2,304 1.152 576 3,456 576 346 1,152 576 230 576 576 1,728 8,641 3,456 6,336 CBD Total 7,488 9,793 7,834 5.415 4,032 34,562 10.0% Future Employment NON CBD Retail 256 640 NON CBD Non-Retail 128 256 384 128 84 960 384 384 128 1,792 NON CBD Service 84 128 64 64 64 384 NON CBD Other 384 64 38 26 192 704 NON CBD Total 832 1.088 870 602 448 3.840 Opeeing file in Protected View X ol - 56 - HBW Attractions = 1.45 x Total Employment X E Zone 1 Future Employment 1,280 640 2,560 3,840 8,321 N 6,400 2,560 1,280 640 10,881 3,840 3,840 640 384 8,705 4 4 3,840 1,280 640 256 6,016 on 5 1,280 640 640 1,920 4,480 Sum 17,921 9,601 3,840 7,040 38,403 HBW Attractions = 1.45 x 8,321 = 12,065 Zone 1 2 3 4 5 ATTRACTIONS HBW HBO NHB 12,065 23,723 15,649 15,777 32,461 20,061 12,622 21,974 13,358 8,724 23,151 13,955 6,496 14,277 9,330 I TOTAL 55,684 115,587 72,353 HBW Attractions = 1.45 x 8,321 = 12,065 HBO CBD Attractions = 2.00 x CBD RE + 1.7 x SE + 0.5 x OE + 0.9 x HH Zone her 1 UN 640 3,840 2 3 4 Future Households 5,997 5,660 5,025 5,750 3,736 26,168 SON Zone Cors Het CM 2,304 S. >304 2 1 6 6 CHO co Tal 34 24 15. 530 510 4 SN 3456 MM . cu 403 B HBO CBD Attractions = 2.00 x 2,304+ 1.7 x 640 + 0.5 x 3,840 + 0.9 x 5,997 HBO CBD Attractions = 13,013 HBO NCBD Attractions = 9.00 x NCBD RE + 1.7 x SE + 0.5 x OE + 0.9 x HH 1 640 3,840 1 1 LE 1 Future Households 5,997 5,660 5,025 5.750 3,736 26,168 OCTO NOBO HON NOGO NORD TORCH T 1 256 G TEL 3 SP HBO NCBD Attractions = 9.00 x 256+ 1.7 x 640 + 0.5 x 3,840 + 0.9 x 5,997 HBO NCBD Attractions = 10,710 Zone 1 2 I 3 4 5 AWN ATTRACTIONS HBW HBO NHB 12,065 23,723 15,649 15,777 32,461 20,061 12,622 21,974 13,358 8,724 23,151 13,955 6,496 14,277 9,330 TOTAL 55,684 115,587 72,353 HBO Attractions = CBD Attractions + NCBD Attractions HBO Attractions = 13,013 + 10,710 = 23,723 NHB CBD Attractions = 1.40 x CBD RE + 1.2 x SE + 0.5 x OE + 0.5 x HH Zone Zone Total hurto Na Service 640 11 1 . Other 3,840 2 LADO 3 34 Future Households 5,997 5,660 5,025 5,750 3,736 26,168 4 70 sor 4 254 5 1,20 173 601 100 7.00 CHO 20 1 CBD Toul - 900 Pure Employment CON CHOR Petan CROS CBOO 2,304 50 30 3700 2304 1 570 16 50 30 34 1.154 570 230 19 576 520 1720 16.12 8,845 3,454 6,330 780 2 3 4 5 TILL 45 4002 3450 NHB CBD Attractions = 1.40 x 2,304+ 1.2 x 640 + 0.5 x 3,840 + 0.5 x 5,997 NHB CBD Attractions = 8,913 NHB NCBD Attractions = 4.10 x NCBD RE + 1.2 x SE + 0.5 x OE + 0.5 x HH E Zone More 1 2. O 3,840 640 LI 3 4 LIE 25 U . 10 Future Households 5,997 5,660 5,025 5,750 3,736 26,168 Son ORCO 10.0 WORD HRONO NOGO OCDD O NON CRO 1 256 SAD 124 TUIRE 4 SO 13 M 314 100 40 380 NHB NCBD Attractions = 4.10 x NCBD RE + 1.2 x SE + 0.5 x OE + 0.5 x HH NHB NCBD Attractions = 4.10 x 256+ 1.2 x 640 + 0.5 x 3,840 + 0.5 x 5,997 NHB NCBD Attractions = 5 = 6,736 Zone 1 2 3 4 5 ATTRACTIONS HBW HBO NHB 12,065 23,723 15,649 15,777 32,461 20,061 12,622 21,974 13,358 8,724 23,151 13,955 6,496 14,277 9,330 TOTAL 55,684 115,587 72,353 NHB Attractions = CBD Attractions + NCBD Attractions NHB Attractions = 8,913 +6,736 = 15,649 Zone 1 2 3 4 5 PRODUCTIONS HBW HBO 12,275 30,502 11,038 27,660 9,314 23,556 11,769 29,246 8,008 19,747 NHB 12,665 11,336 9,516 12,143 8,298 Zone 1 2 3 4 5 ATTRACTIONS HBW HBO NHB 12,065 23,723 15,649 15,777 32,461 20,061 12,622 21,974 13,358 8,724 23,151 13,955 6,496 14,277 9,330 TOTAL 52,405 130,711 53,958 TOTAL 55,684 115,587 72,353 237,074 243,624 3. Using NCHRP Report #365's Cross Classification methodology determine the number of Home-based Work (HBW), Home-based Other (HBO), and Non-Home Based (NHB) trips in each zone. The projected income distribution of households within the study area is as follows: I Income Distribution Zone 1 LOW MED HIGH 1 20% 60% 20% 2 2 15% 55% 30% 3 20% 60% 20% 4 15% 55% 30% 5 10% 45% 45% Income Category Avg Daily FROM NCHRP REPORT 365 Income Person- TABLE 9 Range Trips/ ($K) % of Daily Person-Trips Household HBW HBO NHB 0 - 19.9 6.0 18 59 23 20 - 39.9 8.9 23 55 22 40 + 11.5 22 54 24 LOW MED HIGH Existing Income Distribution for TRTOWN Zone 1 Zone 2 Zone 3 Zone 4 Zone 5 15% 20% 25% 15% 10% 55% 60% 65% 55% 50% 30% 20% 10% 30% 40% 100% 100% 100% 100% 100% 5,997 HH X 15% x 6.0 x 18% = 972 Daily Person- Trips/HH % HBW Zone 1 HH Households % Low HBW TRIP PRODUCTIONS Future Income Avg DAY Income Person.Top Category Range (SK) Household 5,997 LOW 0199 6.0 5,660 Income MED 30 5,025 HOH 5,750 Zone 1 Zone 2 Zone 3 Zone 4 3,736 LOW 15% 20% 25% 15% 26,168 MED 55% 60% 65% 55% HIGH 30% 20% 10% 30% FROM NCRP REPORT 305 ADLE9 % of by Person Trips HOW HBO NHB 18 59 23 23 55 22 54 24 The above calculation would need to be repeated for each income category and trip purpose... ZONE 1 LOW MED HIGH TOTALS HEW 972 6,752 4,552 12,275 HBO NHD 3,184 1,241 16,145 6,458 11.172 4.066 30,502 12,665 ZONE 1 HBW HBO NHB LOW 972 3,184 1,241 MED 6,752 16,145 6,458 HIGH 4,552 11,172 4,966 TOTALS 12,275 30,502 12,665 The above HWB, HBO, & NHB productions are then summarized as follows for each zone... PRODUCTIONS HBW HBO NHB 12,275 30,502 12,665 11,038 27,660 11,336 9,314 23,556 9,516 11,769 29,246 12,143 8,008 19,747 8,298 52,405 130,711 53,958 HBW Attractions = 1.45 x Total Employment HBO CBD Attractions = 2.00 X CBD RE + 1.7 x SE + 0.5 x OE +0.9 x HH HBO NCBD Attractions = 9.00 x NCBD RE + 1.7 x SE +0.5 x OE +0.9 x HH NHB CBD Attractions = 1.40 X CBD RE + 1.2 x SE + 0.5 x OE + 0.5 x HH NHB NCBD Attractions = 4.10 x NCBD RE + 1.2 x SE + 0.5 x OE + 0.5 x HH CBD RE = Retail Employment in Central Business District Zones (CBD) NCBD RE = Retail Employment in Non-CBD Zones (NCBD) SE = Service Employment OE = Other Employment (Basic and Government) HH = Households E Future Employment Retail Non-Retail Service Other Total 2,560 1,280 640 3,840 8,321 10,881 6,400 2,560 1,280 640 3,840 3,840 640 384 8,705 3,840 1,280 640 256 6,016 1,280 640 640 1,920 4,480 17,921 9,601 3,840 7,040 38,403 90.0% CBD Retail 2,304 5.760 3.456 3,456 1.152 16.129 Future Employment CBD Non- Retail CBD Service CBD Other 1,152 576 3,456 2,304 1.152 576 3,456 576 346 1,152 576 230 576 576 1,728 8,641 3,456 6,336 CBD Total 7,488 9,793 7,834 5.415 4,032 34,562 10.0% Future Employment NON CBD Retail 256 640 NON CBD Non-Retail 128 256 384 128 84 960 384 384 128 1,792 NON CBD Service 84 128 64 64 64 384 NON CBD Other 384 64 38 26 192 704 NON CBD Total 832 1.088 870 602 448 3.840 Opeeing file in Protected View X ol - 56 - HBW Attractions = 1.45 x Total Employment X E Zone 1 Future Employment 1,280 640 2,560 3,840 8,321 N 6,400 2,560 1,280 640 10,881 3,840 3,840 640 384 8,705 4 4 3,840 1,280 640 256 6,016 on 5 1,280 640 640 1,920 4,480 Sum 17,921 9,601 3,840 7,040 38,403 HBW Attractions = 1.45 x 8,321 = 12,065 Zone 1 2 3 4 5 ATTRACTIONS HBW HBO NHB 12,065 23,723 15,649 15,777 32,461 20,061 12,622 21,974 13,358 8,724 23,151 13,955 6,496 14,277 9,330 I TOTAL 55,684 115,587 72,353 HBW Attractions = 1.45 x 8,321 = 12,065 HBO CBD Attractions = 2.00 x CBD RE + 1.7 x SE + 0.5 x OE + 0.9 x HH Zone her 1 UN 640 3,840 2 3 4 Future Households 5,997 5,660 5,025 5,750 3,736 26,168 SON Zone Cors Het CM 2,304 S. >304 2 1 6 6 CHO co Tal 34 24 15. 530 510 4 SN 3456 MM . cu 403 B HBO CBD Attractions = 2.00 x 2,304+ 1.7 x 640 + 0.5 x 3,840 + 0.9 x 5,997 HBO CBD Attractions = 13,013 HBO NCBD Attractions = 9.00 x NCBD RE + 1.7 x SE + 0.5 x OE + 0.9 x HH 1 640 3,840 1 1 LE 1 Future Households 5,997 5,660 5,025 5.750 3,736 26,168 OCTO NOBO HON NOGO NORD TORCH T 1 256 G TEL 3 SP HBO NCBD Attractions = 9.00 x 256+ 1.7 x 640 + 0.5 x 3,840 + 0.9 x 5,997 HBO NCBD Attractions = 10,710 Zone 1 2 I 3 4 5 AWN ATTRACTIONS HBW HBO NHB 12,065 23,723 15,649 15,777 32,461 20,061 12,622 21,974 13,358 8,724 23,151 13,955 6,496 14,277 9,330 TOTAL 55,684 115,587 72,353 HBO Attractions = CBD Attractions + NCBD Attractions HBO Attractions = 13,013 + 10,710 = 23,723 NHB CBD Attractions = 1.40 x CBD RE + 1.2 x SE + 0.5 x OE + 0.5 x HH Zone Zone Total hurto Na Service 640 11 1 . Other 3,840 2 LADO 3 34 Future Households 5,997 5,660 5,025 5,750 3,736 26,168 4 70 sor 4 254 5 1,20 173 601 100 7.00 CHO 20 1 CBD Toul - 900 Pure Employment CON CHOR Petan CROS CBOO 2,304 50 30 3700 2304 1 570 16 50 30 34 1.154 570 230 19 576 520 1720 16.12 8,845 3,454 6,330 780 2 3 4 5 TILL 45 4002 3450 NHB CBD Attractions = 1.40 x 2,304+ 1.2 x 640 + 0.5 x 3,840 + 0.5 x 5,997 NHB CBD Attractions = 8,913 NHB NCBD Attractions = 4.10 x NCBD RE + 1.2 x SE + 0.5 x OE + 0.5 x HH E Zone More 1 2. O 3,840 640 LI 3 4 LIE 25 U . 10 Future Households 5,997 5,660 5,025 5,750 3,736 26,168 Son ORCO 10.0 WORD HRONO NOGO OCDD O NON CRO 1 256 SAD 124 TUIRE 4 SO 13 M 314 100 40 380 NHB NCBD Attractions = 4.10 x NCBD RE + 1.2 x SE + 0.5 x OE + 0.5 x HH NHB NCBD Attractions = 4.10 x 256+ 1.2 x 640 + 0.5 x 3,840 + 0.5 x 5,997 NHB NCBD Attractions = 5 = 6,736 Zone 1 2 3 4 5 ATTRACTIONS HBW HBO NHB 12,065 23,723 15,649 15,777 32,461 20,061 12,622 21,974 13,358 8,724 23,151 13,955 6,496 14,277 9,330 TOTAL 55,684 115,587 72,353 NHB Attractions = CBD Attractions + NCBD Attractions NHB Attractions = 8,913 +6,736 = 15,649 Zone 1 2 3 4 5 PRODUCTIONS HBW HBO 12,275 30,502 11,038 27,660 9,314 23,556 11,769 29,246 8,008 19,747 NHB 12,665 11,336 9,516 12,143 8,298 Zone 1 2 3 4 5 ATTRACTIONS HBW HBO NHB 12,065 23,723 15,649 15,777 32,461 20,061 12,622 21,974 13,358 8,724 23,151 13,955 6,496 14,277 9,330 TOTAL 52,405 130,711 53,958 TOTAL 55,684 115,587 72,353 237,074 243,624
Step by Step Solution
There are 3 Steps involved in it

Get step-by-step solutions from verified subject matter experts