

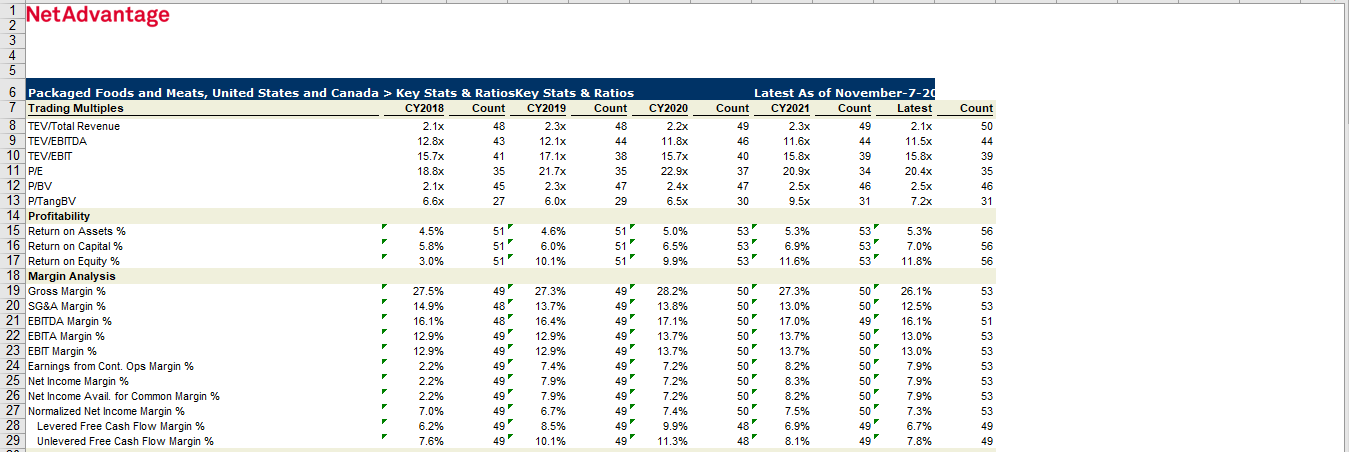
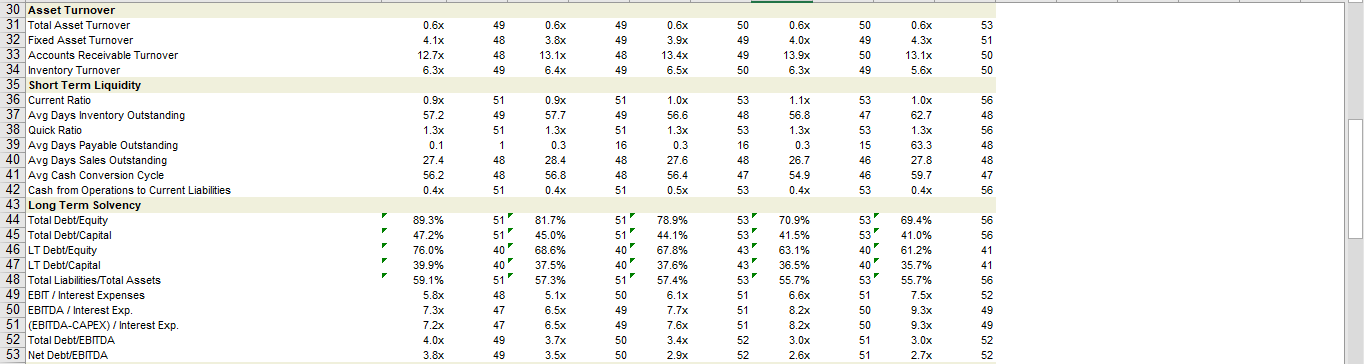
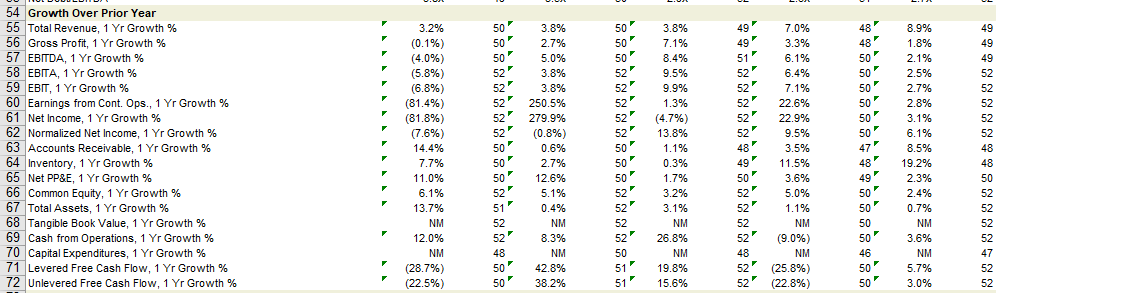
Question: 3) Using relevant financial statements and ratios: a) Analyze productivity and general working capital management and explain how it stands in relation to its competitors;
3) Using relevant financial statements and ratios: a) Analyze productivity and general working capital management and explain how it stands in relation to its competitors; b) establish links between liquidity management and the statement of cash flows
data pictures are given below:
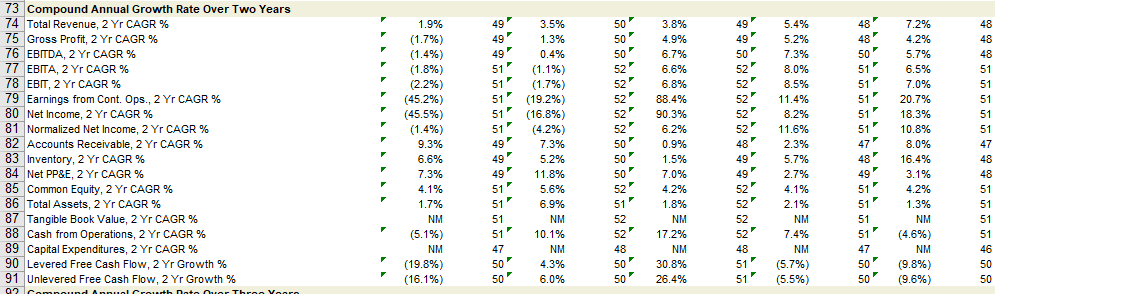
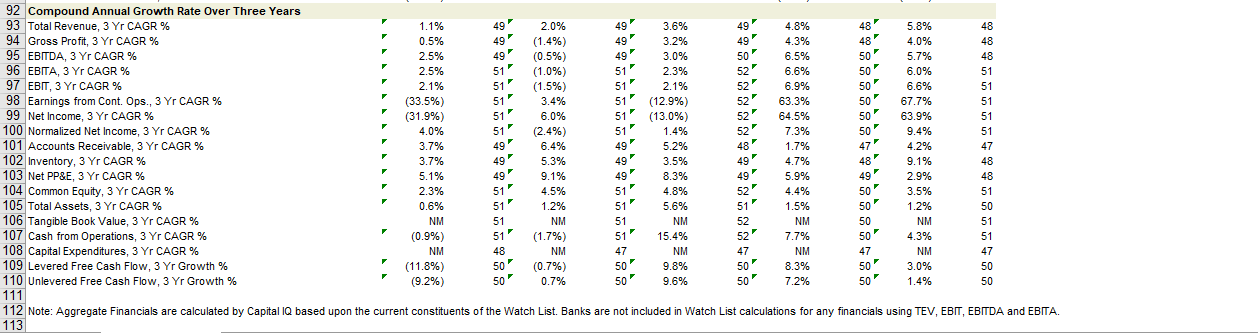
73 Compound Annual Growth Rate Over Two Years 92 Compound Annual Growth Rate Over Three Years 93 Total Revenue, 3 Yr CAGR \% 94 Gross Profit, 3 Yr CAGR \% 95 EBIDA, 3 Yr CAGR \% 96 EBIA, 3 Yr CAGR \% 97 EB, 3 Yr CAGR \% 98 Earnings from Cont. Ops., 3 Yr CAGR % 99 Net Income, 3 Yr CAGR \% 100 Normalized Net Income, 3 Yr CAGR \% 101 Accounts Receivable, 3 Yr CAGR \% 102 Inventory, 3 Yr CAGR \% 103 Net PP\&E, 3 Yr CAGR \% 104 Common Equity, 3 Yr CAGR \% 105 Total Assets, 3 Yr CAGR \% 106 Tangible Book Value, 3 Yr CAGR \% 107 Cash from Operations, 3 Yr CAGR \% 108 Capital Expenditures, 3 Yr CAGR \% 109 Levered Free Cash Flow, 3 Yr Growth \% 110 Unlevered Free Cash Flow, 3 Yr Growth \% Note: Aggregate Financials are calculated by Capital IQ based upon the current constituents of the Watch List. Banks are not included in Watch List calculations for any financials using TEV, EBT, EBrDA and EBA. 73 Compound Annual Growth Rate Over Two Years 92 Compound Annual Growth Rate Over Three Years 93 Total Revenue, 3 Yr CAGR \% 94 Gross Profit, 3 Yr CAGR \% 95 EBIDA, 3 Yr CAGR \% 96 EBIA, 3 Yr CAGR \% 97 EB, 3 Yr CAGR \% 98 Earnings from Cont. Ops., 3 Yr CAGR % 99 Net Income, 3 Yr CAGR \% 100 Normalized Net Income, 3 Yr CAGR \% 101 Accounts Receivable, 3 Yr CAGR \% 102 Inventory, 3 Yr CAGR \% 103 Net PP\&E, 3 Yr CAGR \% 104 Common Equity, 3 Yr CAGR \% 105 Total Assets, 3 Yr CAGR \% 106 Tangible Book Value, 3 Yr CAGR \% 107 Cash from Operations, 3 Yr CAGR \% 108 Capital Expenditures, 3 Yr CAGR \% 109 Levered Free Cash Flow, 3 Yr Growth \% 110 Unlevered Free Cash Flow, 3 Yr Growth \% Note: Aggregate Financials are calculated by Capital IQ based upon the current constituents of the Watch List. Banks are not included in Watch List calculations for any financials using TEV, EBT, EBrDA and EBA
Step by Step Solution
There are 3 Steps involved in it

Get step-by-step solutions from verified subject matter experts