

Question: 3 Using the Base Case, calculate the change in non-cash working capital in 2024E. -$1,322 -$2,446 $2,446 $1,322 Review Later Income Statement Sales Revenue
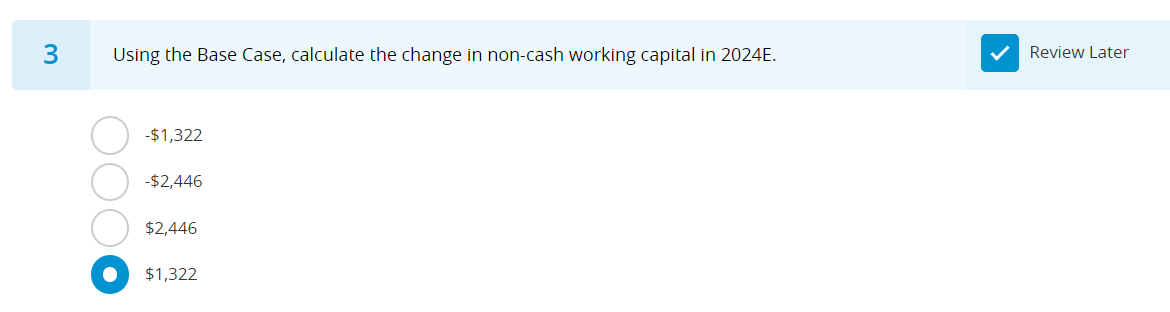
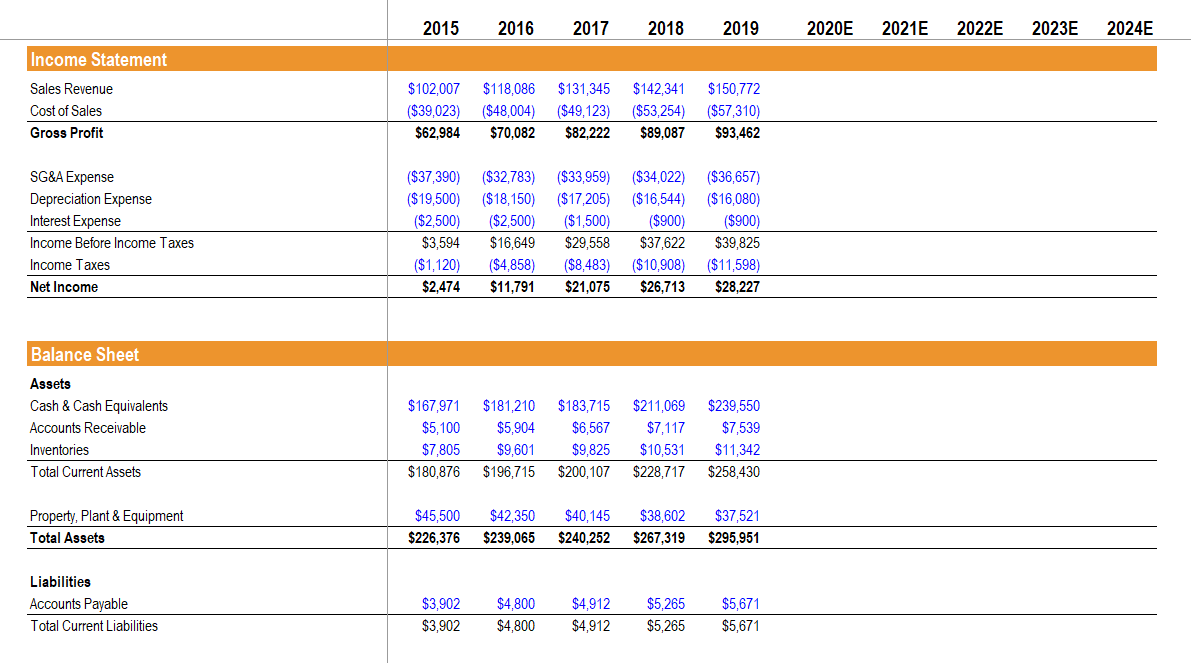
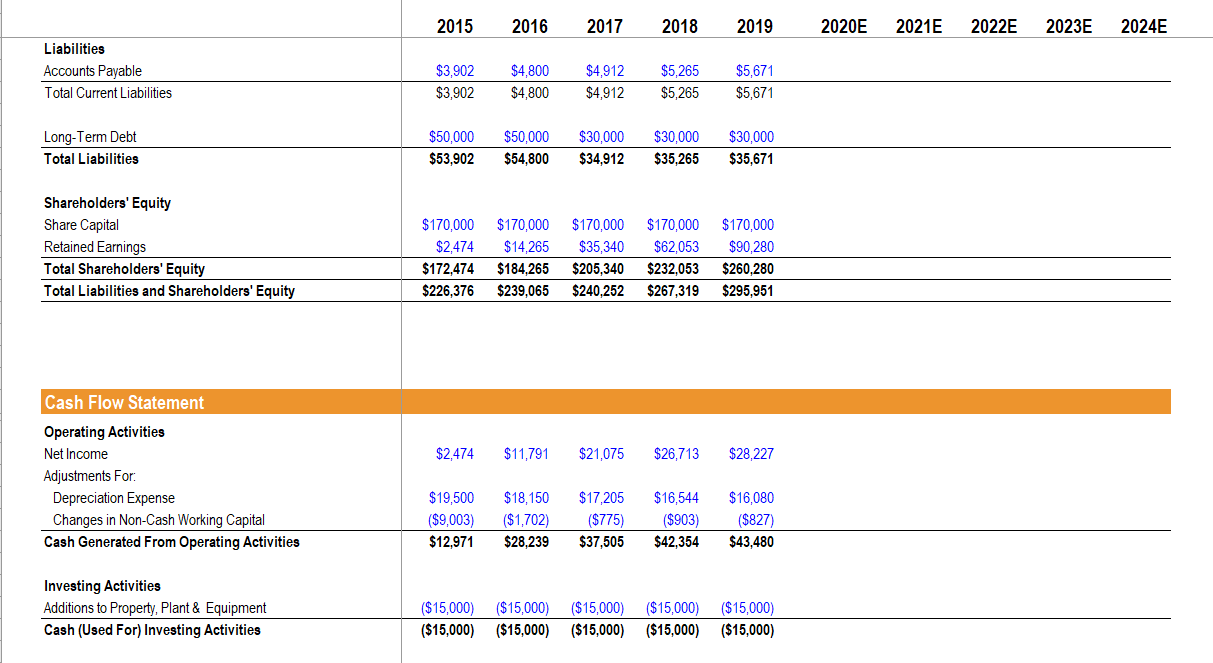
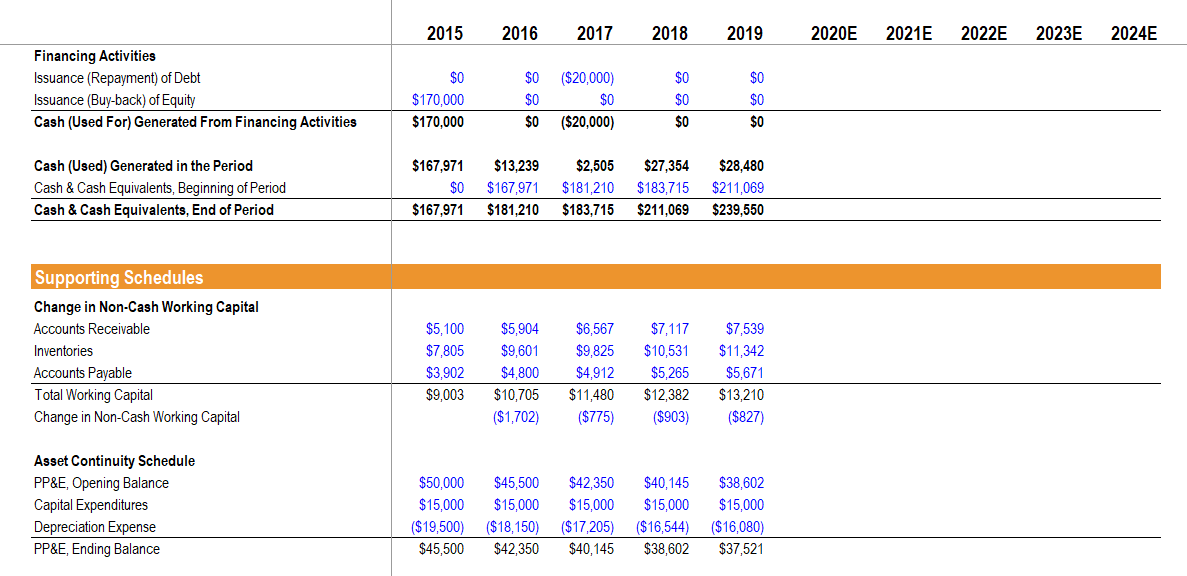
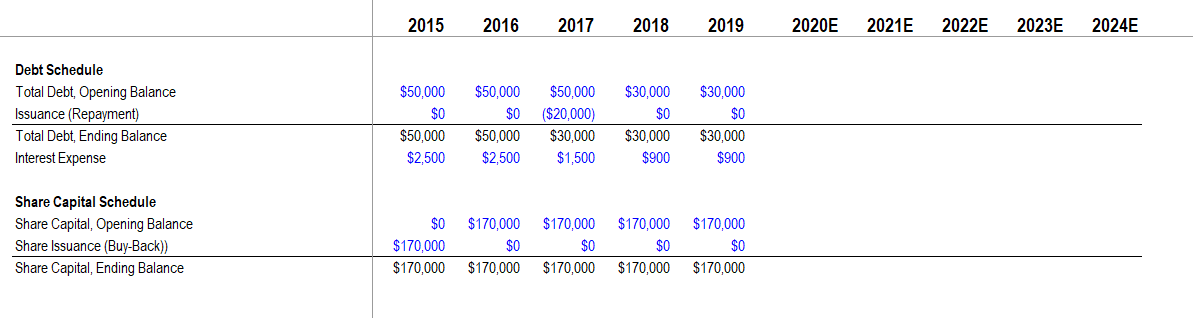
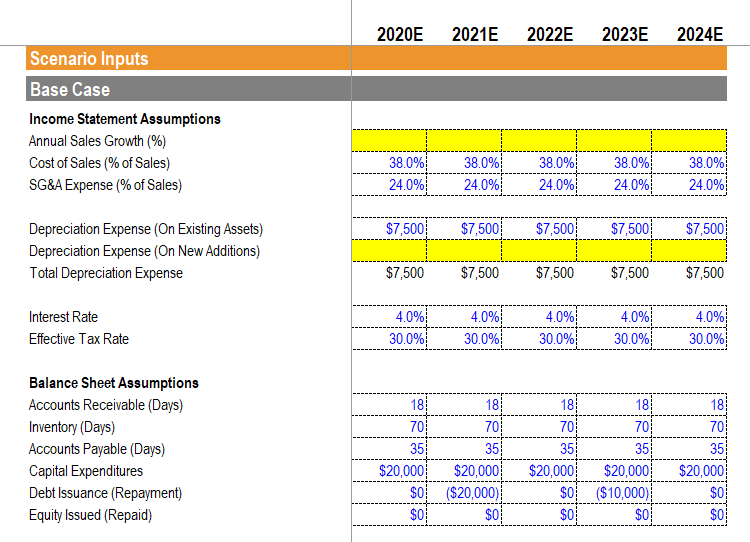
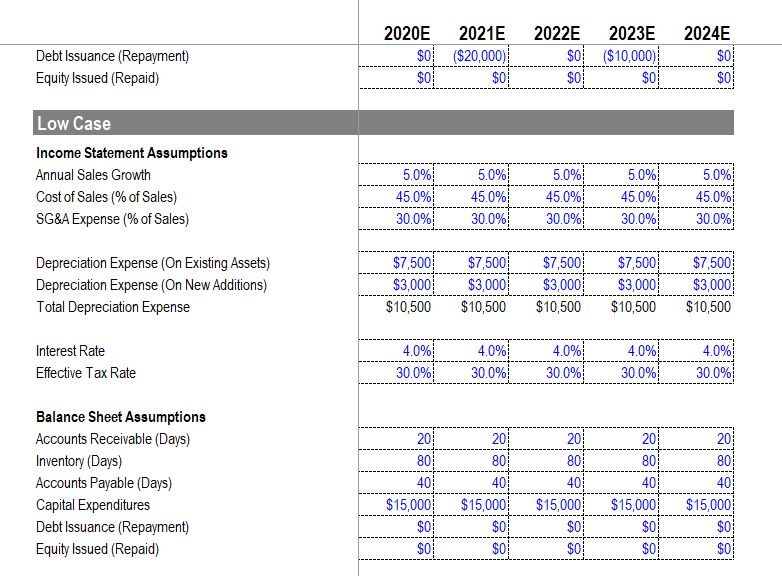
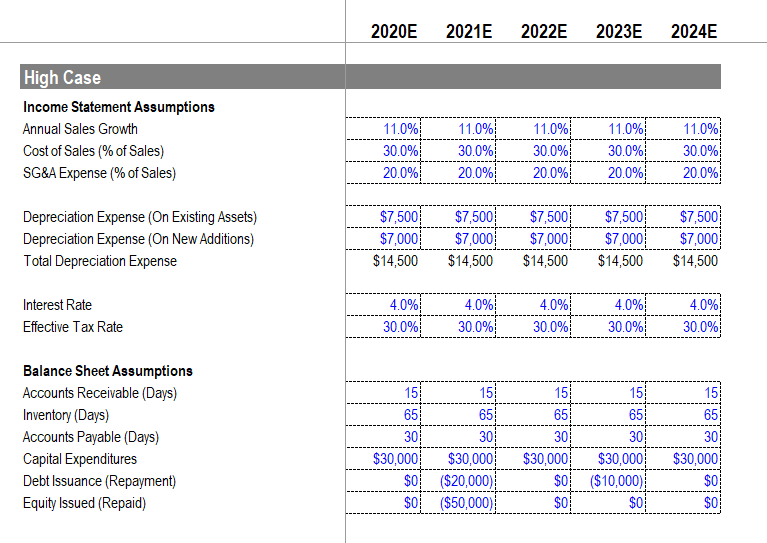
3 Using the Base Case, calculate the change in non-cash working capital in 2024E. -$1,322 -$2,446 $2,446 $1,322 Review Later Income Statement Sales Revenue Cost of Sales Gross Profit SG&A Expense Depreciation Expense Interest Expense Income Before Income Taxes Income Taxes Net Income Balance Sheet Assets Cash & Cash Equivalents Accounts Receivable Inventories Total Current Assets Property, Plant & Equipment Total Assets Liabilities Accounts Payable Total Current Liabilities 2015 2016 2017 2018 2019 $102,007 $118,086 $131,345 $142,341 $150,772 ($39,023) ($48,004) ($49,123) ($53,254) ($57,310) $62,984 $70,082 $82,222 $89,087 $93,462 ($16,080) ($37,390) ($32,783) ($33,959) ($34,022) ($36,657) ($19,500) ($18,150) ($17,205) ($16,544) ($2,500) ($1,500) ($900) $16,649 $29,558 $37,622 ($2,500) $3,594 ($1,120) $2,474 $45,500 $226,376 ($4,858) ($8,483) ($10,908) $11,791 $21,075 $26,713 $167,971 $181,210 $183,715 $211,069 $5,904 $6,567 $7,117 $5,100 $7,805 $9,601 $9,825 $10,531 $180,876 $196,715 $200,107 $228,717 $42,350 $40,145 $38,602 $239,065 $240,252 $267,319 ($900) $39,825 ($11,598) $28,227 $239,550 $7,539 $11,342 $258,430 $37,521 $295,951 $3,902 $4,800 $4,912 $5,265 $5,671 $3,902 $4,800 $4,912 $5,265 $5,671 2020E 2021E 2022E 2023E 2024E Liabilities Accounts Payable Total Current Liabilities Long-Term Debt Total Liabilities Shareholders' Equity Share Capital Retained Earnings Total Shareholders' Equity Total Liabilities and Shareholders' Equity Cash Flow Statement Operating Activities Net Income Adjustments For: Depreciation Expense Changes in Non-Cash Working Capital Cash Generated From Operating Activities Investing Activities Additions to Property, Plant & Equipment Cash (Used For) Investing Activities 2015 $3,902 $3,902 $170,000 $2,474 $172,474 $226,376 2016 2017 2018 2019 $50,000 $50,000 $53,902 $54,800 $34,912 $2,474 $4,800 $4,912 $5,265 $5,671 $4,800 $4,912 $5,265 $5,671 $30,000 $30,000 $30,000 $35,265 $35,671 $170,000 $170,000 $170,000 $170,000 $14,265 $35,340 $62,053 $90,280 $260,280 $184,265 $205,340 $232,053 $239,065 $240.252 $267,319 $295,951 $11,791 $21,075 $26,713 $28,227 $19,500 $18,150 $17,205 $16,544 ($9,003) ($1,702) ($775) ($903) $12,971 $28,239 $37,505 $42,354 $16,080 ($827) $43,480 ($15,000) ($15,000) ($15,000) ($15,000) ($15,000) ($15,000) ($15,000) ($15,000) ($15,000) ($15,000) 2020E 2021E 2022E 2023E 2024E Financing Activities Issuance (Repayment) of Debt Issuance (Buy-back) of Equity Cash (Used For) Generated From Financing Activities Cash (Used) Generated in the Period Cash & Cash Equivalents, Beginning of Period Cash & Cash Equivalents, End of Period Supporting Schedules Change in Non-Cash Working Capital Accounts Receivable Inventories Accounts Payable Total Working Capital Change in Non-Cash Working Capital Asset Continuity Schedule PP&E, Opening Balance Capital Expenditures Depreciation Expense PP&E, Ending Balance 2015 $0 $170,000 $170,000 $167,971 $167,971 2016 2017 ($20,000) $0 $3,902 $9,003 $0 $0 $0 ($20,000) 2018 $0 $0 $0 $2,505 $27,354 $28,480 $13,239 $0 $167,971 $181,210 $183,715 $211,069 $181,210 $183,715 $211,069 $239,550 $5,100 $5,904 $6,567 $7,117 $7,805 $9,601 $9,825 $10,531 $4,800 $4,912 $5,265 $10,705 $11,480 $12,382 ($1,702) ($775) ($903) 2019 $0 $0 $0 $7,539 $11,342 $5,671 $13,210 ($827) $50,000 $45,500 $42,350 $40,145 $38,602 $15,000 $15,000 $15,000 $15,000 $15,000 ($19,500) ($18,150) ($17,205) ($16,544) ($16,080) $45,500 $42,350 $40,145 $38,602 $37,521 2020E 2021E 2022E 2023E 2024E Debt Schedule Total Debt, Opening Balance Issuance (Repayment) Total Debt, Ending Balance Interest Expense Share Capital Schedule Share Capital, Opening Balance Share Issuance (Buy-Back)) Share Capital, Ending Balance 2015 $50,000 $0 $50,000 $2,500 2016 2017 2018 $30,000 $50,000 $50,000 $0 ($20,000) $50,000 $30,000 $30,000 $0 $2,500 $1,500 $900 $0 $170,000 $170,000 $0 $170,000 $170,000 $170,000 $170,000 $0 $0 $170,000 $170,000 2019 $30,000 $0 $30,000 $900 $170,000 $0 $170,000 2020E 2021E 2022E 2023E 2024E Scenario Inputs Base Case Income Statement Assumptions Annual Sales Growth (%) Cost of Sales (% of Sales) SG&A Expense (% of Sales) Depreciation Expense (On Existing Assets) Depreciation Expense (On New Additions) Total Depreciation Expense Interest Rate Effective Tax Rate Balance Sheet Assumptions Accounts Receivable (Days) Inventory (Days) Accounts Payable (Days) Capital Expenditures Debt Issuance (Repayment) Equity Issued (Repaid) 2020E 2021E 38.0% 24.0% $7,500 $7,500 4.0% 30.0% 18 70 35 $20,000 $0 $0 38.0% 24.0% $7,500 $7,500 $7,500 4.0% 30.0% 18 70 35 2022E 2023E 2024E $20,000 ($20,000) $0 38.0% 24.0% 4.0%! $7,500 $7,500 30.0% 38.0% 24.0% 18 70 35 $20,000 $0 $0 $7,500 4.0% 30.0% 18 70 35 $20,000 ($10,000) $0 38.0% 24.0% $7,500 $7,500 4.0% 30.0% 18 70 35 $20,000 $0 $0 Debt Issuance (Repayment) Equity Issued (Repaid) Low Case Income Statement Assumptions Annual Sales Growth Cost of Sales (% of Sales) SG&A Expense (% of Sales) Depreciation Expense (On Existing Assets) Depreciation Expense (On New Additions) Total Depreciation Expense Interest Rate Effective Tax Rate Balance Sheet Assumptions Accounts Receivable (Days) Inventory (Days) Accounts Payable (Days) Capital Expenditures Debt Issuance (Repayment) Equity Issued (Repaid) 2020E 2021E ($20,000) $0 $0 $0 5.0% 45.0% 30.0% 4.0% 30.0% 5.0%! 20 80 40 $15,000 $0 $0 45.0% 30.0% 4.0%! 2022E 2023E $0 ($10,000) $0 $0 30.0% 5.0%! $7,500 $7,500 $3,000 $3,000 $7,500 $7,500 $7,500 $3,000 $3,000 $3,000 $10,500 $10,500 $10,500 $10,500 $10,500 20 80 40 45.0% 30.0% 4.0% 30.0% 201 80 40 $15,000 $15,000 $0 $0 5.0% 45.0% 30.0% $0 $0 4.0% 30.0% 2024E $0 $0 20 80 40 $15,000 $0 $0 5.0% 45.0% 30.0% 4.0% 30.0% 20 80 40 $15,000 $0 $0 High Case Income Statement Assumptions Annual Sales Growth Cost of Sales (% of Sales) SG&A Expense (% of Sales) Depreciation Expense (On Existing Assets) Depreciation Expense (On New Additions) Total Depreciation Expense Interest Rate Effective Tax Rate Balance Sheet Assumptions Accounts Receivable (Days) Inventory (Days) Accounts Payable (Days) Capital Expenditures Debt Issuance (Repayment) Equity Issued (Repaid) 2020E 2021E 11.0% 30.0% 20.0% 4.0% 30.0% 11.0% 30.0% 20.0% 15 65 30 $30,000 $0 $0 $7,500 $7,500 $7,500 $7,500 $7,000 $7,000 $7,000 $7,000 $14,500 $14,500 $14,500 $14,500 4.0% 30.0% 15! 65 30 2022E 2023E $30,000 ($20,000) ($50,000) 11.0% 30.0% 20.0% 4.0% 30.0% 11.0% 30.0%! 20.0% 15 65 30 $30,000 $0 $0 4.0% 30.0% 15 65 30 $30,000 ($10,000) $0 2024E 11.0% 30.0% 20.0% $7,500 $7,000 $14,500 4.0% 30.0% 15! 65 30 $30,000 $0 $0
Step by Step Solution
3.41 Rating (148 Votes )
There are 3 Steps involved in it
The detailed answer for the above ... View full answer

Get step-by-step solutions from verified subject matter experts