

Question: 3. Using the data below on States' populations, GDP and average working hours in 2021 of a sample of US cities, please find the following
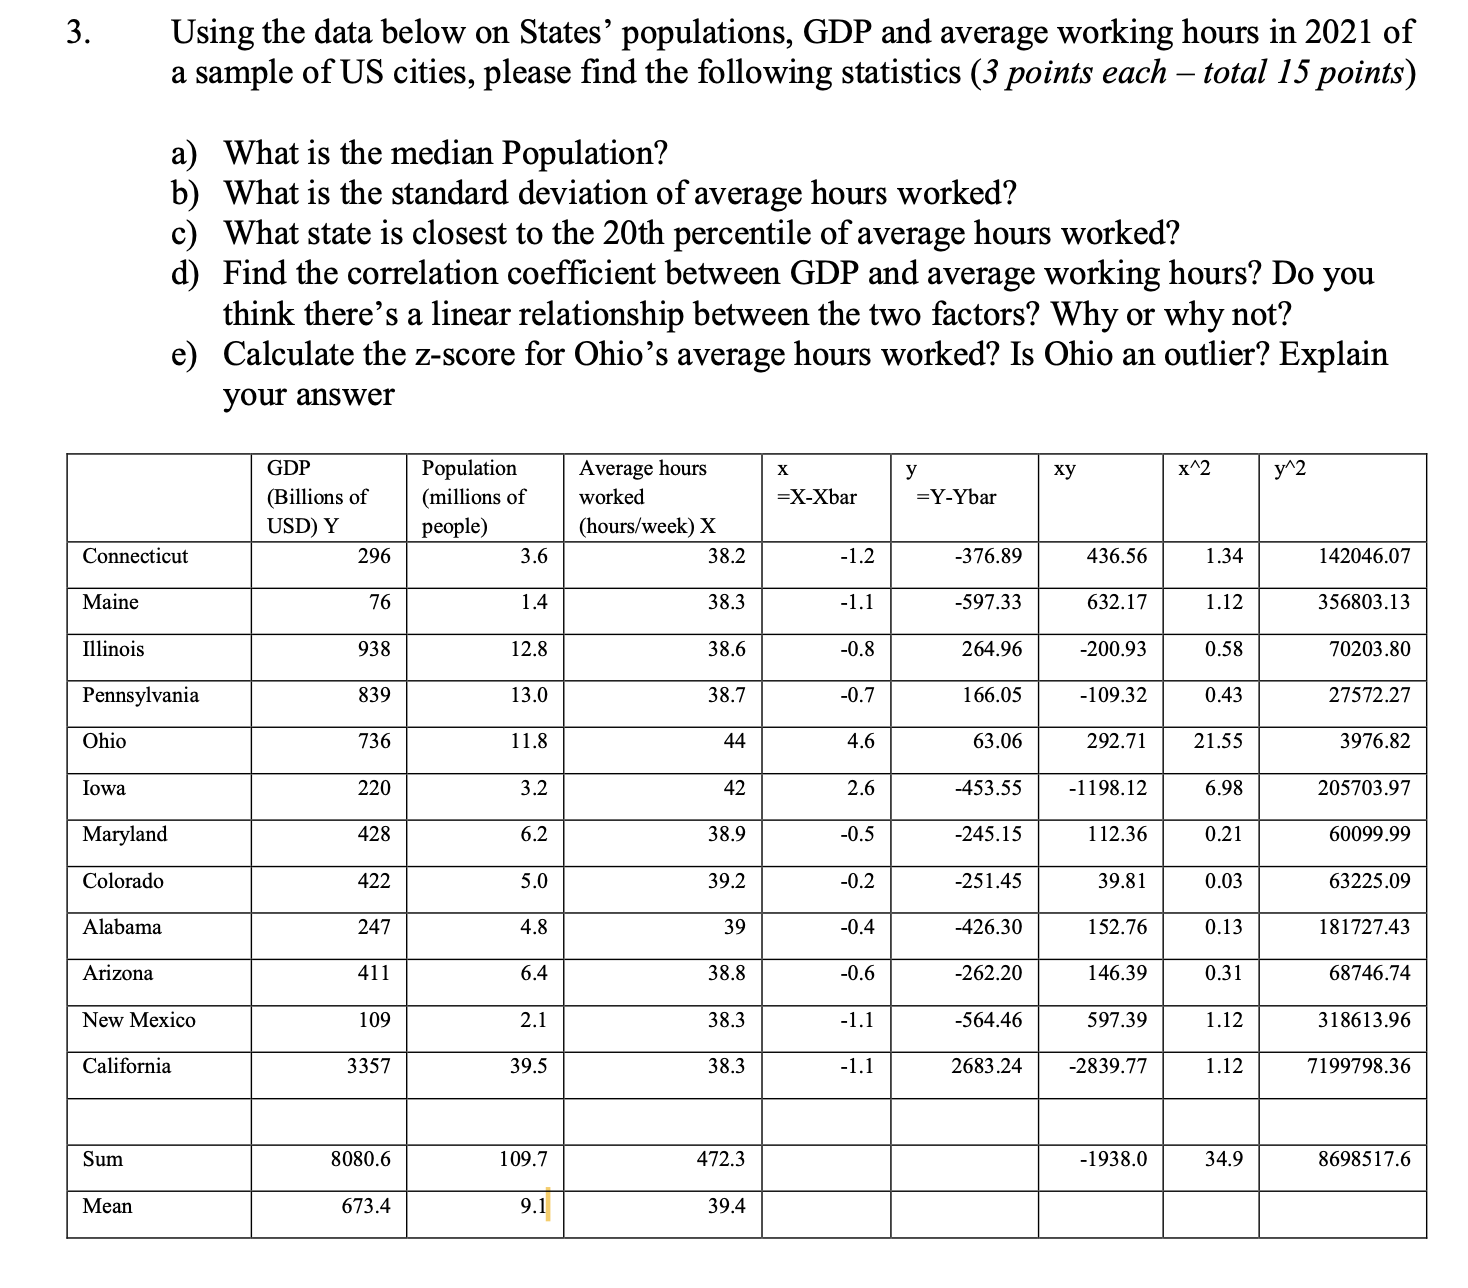
3. Using the data below on States' populations, GDP and average working hours in 2021 of a sample of US cities, please find the following statistics (3 points each - total 15 points) a) What is the median Population? b) What is the standard deviation of average hours worked? c What state is closest to the 20th percentile of average hours worked? d) Find the correlation coefficient between GDP and average working hours? Do you think there's a linear relationship between the two factors? Why or why not? e) Calculate the z-score for Ohio's average hours worked? Is Ohio an outlier? Explain your answer GDP Population Average hours X y xy x12 (Billions of (millions of worked =X-Xbar =Y-Ybar USD) Y people) (hours/week) X Connecticut 296 3.6 38.2 1.2 376.89 436.56 1.34 142046.07 Maine 76 1.4 38.3 -1.1 -597.33 632.17 1.12 356803.13 Illinois 938 12.8 38.6 -0.8 264.96 -200.93 .58 70203.80 Pennsylvania 839 13.0 38.7 -0.7 166.05 -109.32 0.43 27572.27 Ohio 736 11.8 44 4.6 63.06 292.71 21.5 3976.82 Iowa 220 3.2 42 2.6 453.55 -1198.12 6.98 205703.97 Maryland 428 6.2 38 9 -0.5 -245.15 1 12.36 0.21 60099.99 Colorado 422 5.0 39.2 0.2 -251.45 39.81 0.03 63225.09 Alabama 247 4.8 39 -0.4 -426.30 152.76 0.13 181727.43 Arizona 411 6.4 38.8 -0.6 -262.20 146.39 0.31 68746.74 New Mexico 109 2.1 38.3 -1.1 564.46 597.39 1.12 318613.96 California 3357 39.5 38.3 -1.1 2683.24 -2839.77 1.12 7199798.36 Sum 8080.6 109 7 472.3 1938.0 34.9 8698517.6 Mean 673.4 9.1 39.4
Step by Step Solution
There are 3 Steps involved in it

Get step-by-step solutions from verified subject matter experts