

Question: 3. Using the diagram below how would the ROA and the ROE change if economic conditions made borrowing money more expensive? Specifically, what would be
3. Using the diagram below how would the ROA and the ROE change if economic conditions made borrowing money more expensive? Specifically, what would be the impact if the interest rate on $50,000 was 10 percent; $100,000, 15 percent; $150,000, 17.5 percent; and $200,000, 20 percent? 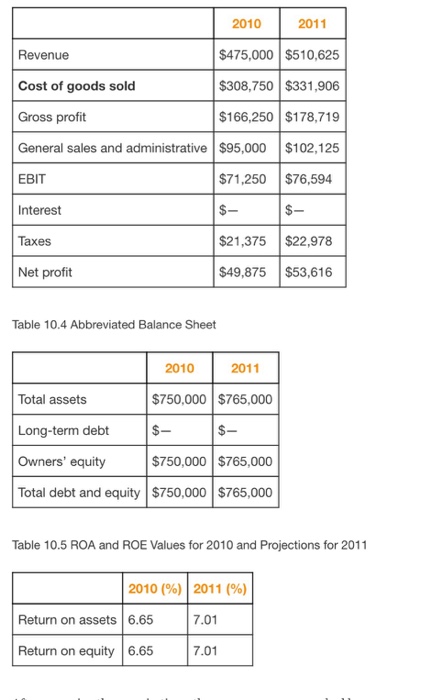
2011 2010 $475,000 $510,625 $308,750 $331,906 $166,250 $178,719 Revenue Cost of goods sold Gross profit General sales and administrative $95,000 $102,125 EBIT Interest Taxes Net profit $71,250$76,594 $21,375$22,978 $49,875 $53,616 Table 10.4 Abbreviated Balance Sheet 2010 2011 Total assets Long-term debt Owners' equity Total debt and equity $750,000 $765,000 $750,000 $765,000 $750,000 $765,000 Table 10.5 ROA and ROE Values for 2010 and Projections for 2011 2010 (%) | 2011 (%) Return on assets 6.65 7.01 Return on equity 6.65 7.01
Step by Step Solution
There are 3 Steps involved in it
1 Expert Approved Answer
Step: 1 Unlock

Question Has Been Solved by an Expert!
Get step-by-step solutions from verified subject matter experts
Step: 2 Unlock
Step: 3 Unlock