

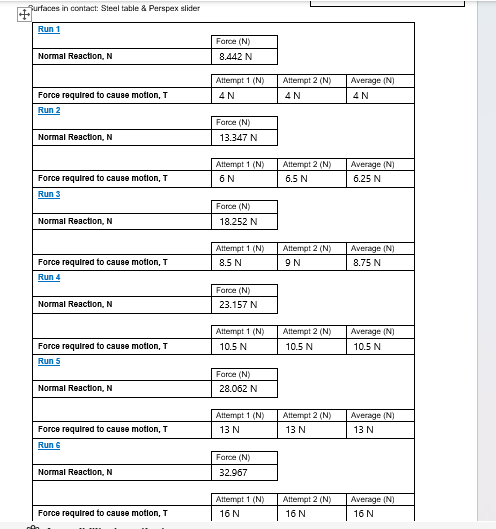
Question: 3 . Using the information gathered in the tables, plot two different graphs showing the relationship between the Normal reaction ( N ) vs Force
Using the information gathered in the tables, plot two different graphs showing the relationship between the Normal reaction N vs Force required T Both graphs must be drawn on the same set of axes, using Excel. Include a trendline for each scatter plot.
Step by Step Solution
There are 3 Steps involved in it
1 Expert Approved Answer
Step: 1 Unlock

Question Has Been Solved by an Expert!
Get step-by-step solutions from verified subject matter experts
Step: 2 Unlock
Step: 3 Unlock