Question: 3. Using Trendlines: Using the data from Excel Supplement Part 3 determine the linear trend for awarded Bachelor's degrees for each of the given engineering
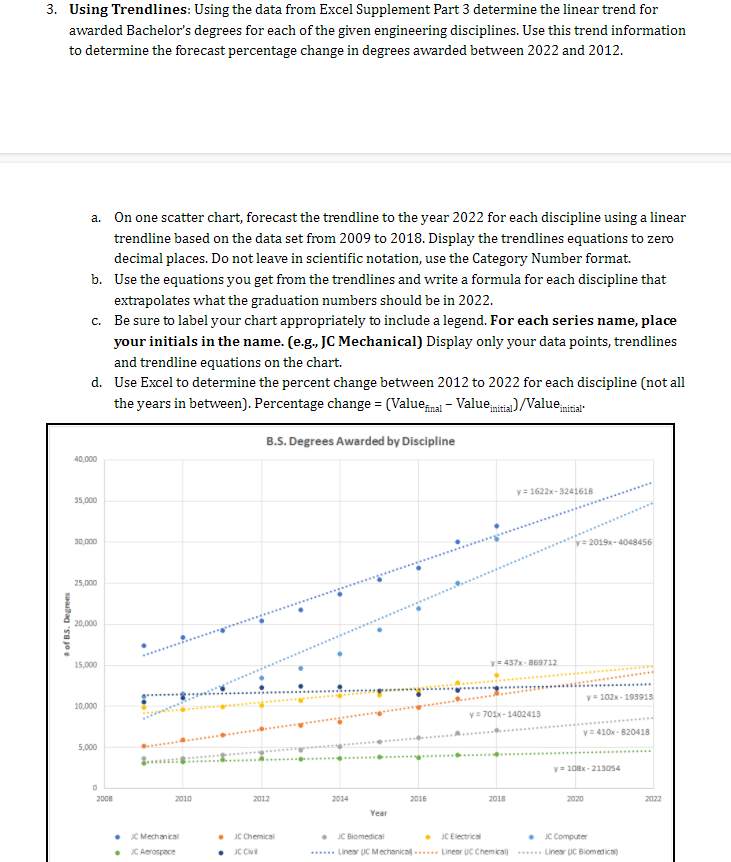
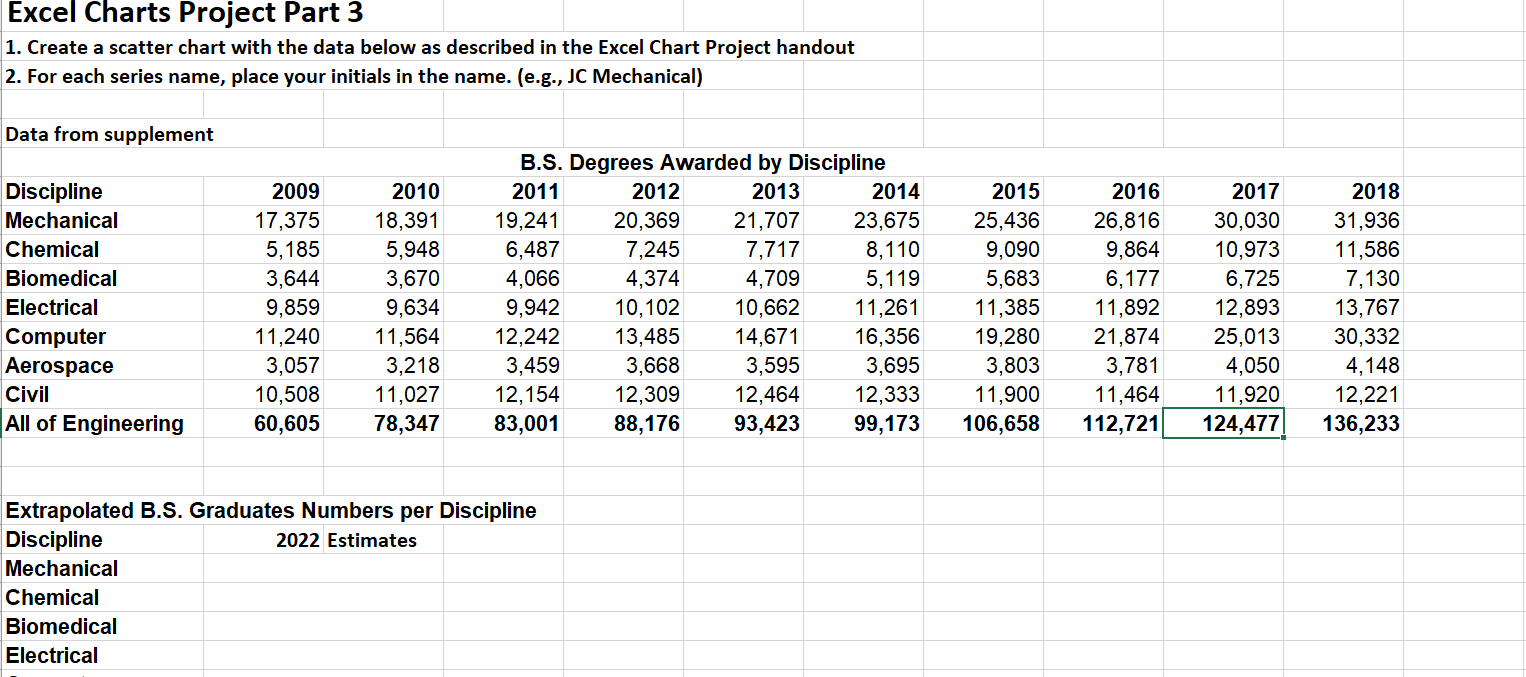
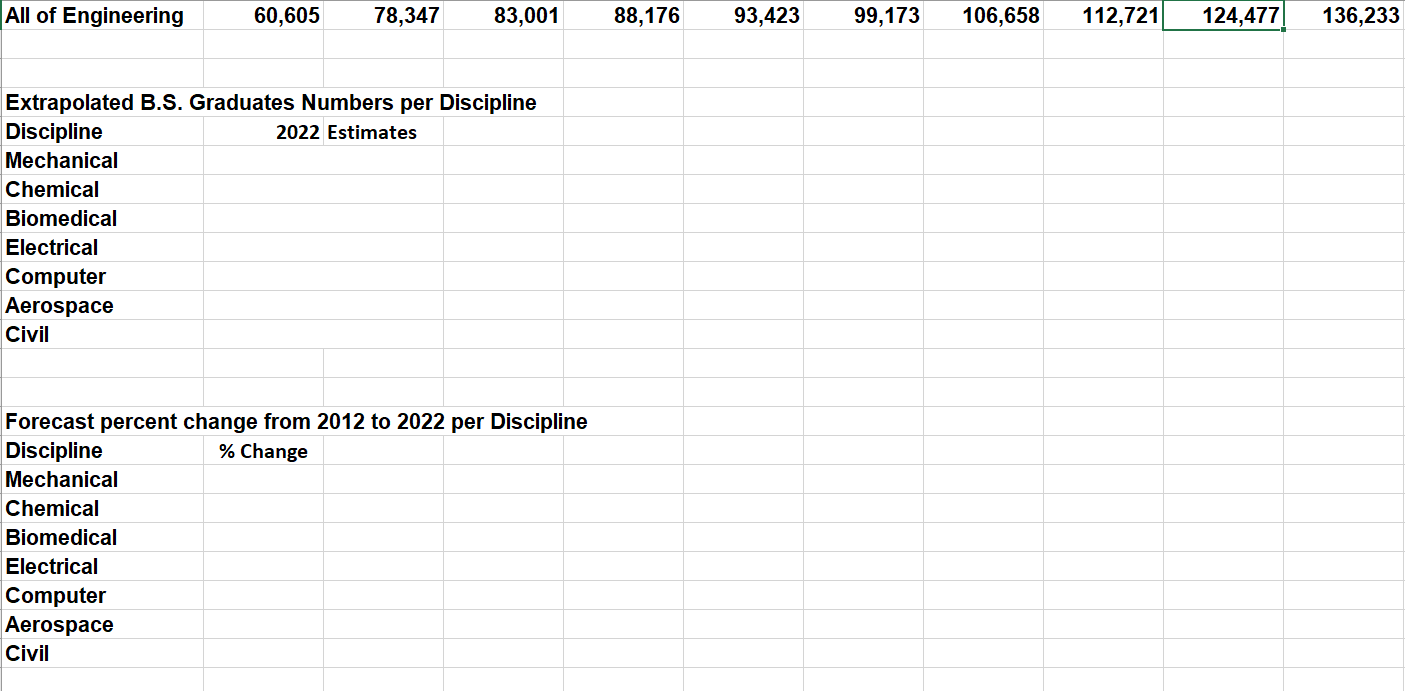
3. Using Trendlines: Using the data from Excel Supplement Part 3 determine the linear trend for awarded Bachelor's degrees for each of the given engineering disciplines. Use this trend information to determine the forecast percentage change in degrees awarded between 2022 and 2012. a. On one scatter chart, forecast the trendline to the year 2022 for each discipline using a linear trendline based on the data set from 2009 to 2018. Display the trendlines equations to zero decimal places. Do not leave in scientific notation, use the Category Number format. b. Use the equations you get from the trendlines and write a formula for each discipline that extrapolates what the graduation numbers should be in 2022. c. Be sure to label your chart appropriately to include a legend. For each series name, place your initials in the name. (e-g., JC Mechanical) Display only your data points, trendlines and trendline equations on the chart. d. Use Excel to determine the percent change between 2012 to 2022 for each discipline (not all the years in between). Percentage change = (Value final Value nitial]/Value.nitial B.S. Degrees Awarded by Discipline 40,000 y = 1622x - 3241618 35,000 30,000 2019-4048456 25,000 of BS. Degrees 20,000 15,000 y = 437x- 869712 y 102-193913 10,000 y = 701x-1402413 Y = 410-820418 5,000 y = 108.213054 D 2010 2012 2014 2015 2018 2020 2022 Year C Mechanical Aerospace JC Chemical COVE C Biomedical JC Electrical Computer ...... Linear UC Mechanica... Linear dic Chemical ..... Linear UC Biomedical . Excel Charts Project Part 3 1. Create a scatter chart with the data below as described in the Excel Chart Project handout 2. For each series name, place your initials in the name. (e.g., JC Mechanical) Data from supplement Discipline Mechanical Chemical Biomedical Electrical Computer Aerospace Civil All of Engineering 2009 17,375 5,185 3,644 9,859 11,240 3,057 10,508 60,605 2010 18,391 5,948 3,670 9,634 11,564 3,218 11,027 78,347 B.S. Degrees Awarded by Discipline 2011 2012 2013 2014 19,241 20,369 21,707 23,675 6,487 7,245 7,717 8,110 4,066 4,374 4,709 5,119 9,942 10,102 10,662 11,261 12,242 13,485 14,671 16,356 3,459 3,668 3.595 3,695 12,154 12,309 12,464 12,333 83,001 88,176 93,423 99,173 2015 25,436 9,090 5,683 11,385 19,280 3,803 11,900 106,658 2016 26,816 9,864 6,177 11,892 21,874 3,781 11,464 112,721 2017 30,030 10,973 6,725 12,893 25,013 4,050 11,920 124,477 2018 31,936 11,586 7,130 13,767 30,332 4,148 12,221 136,233 Extrapolated B.S. Graduates Numbers per Discipline Discipline 2022 Estimates Mechanical Chemical Biomedical Electrical All of Engineering 60,605 78,347 83,001 88,176 93,423 99,173 106,658 112,721 124,477 136,233 Extrapolated B.S. Graduates Numbers per Discipline Discipline 2022 Estimates Mechanical Chemical Biomedical Electrical Computer Aerospace Civil Forecast percent change from 2012 to 2022 per Discipline Discipline % Change Mechanical Chemical Biomedical Electrical Computer Aerospace Civil 3. Using Trendlines: Using the data from Excel Supplement Part 3 determine the linear trend for awarded Bachelor's degrees for each of the given engineering disciplines. Use this trend information to determine the forecast percentage change in degrees awarded between 2022 and 2012. a. On one scatter chart, forecast the trendline to the year 2022 for each discipline using a linear trendline based on the data set from 2009 to 2018. Display the trendlines equations to zero decimal places. Do not leave in scientific notation, use the Category Number format. b. Use the equations you get from the trendlines and write a formula for each discipline that extrapolates what the graduation numbers should be in 2022. c. Be sure to label your chart appropriately to include a legend. For each series name, place your initials in the name. (e-g., JC Mechanical) Display only your data points, trendlines and trendline equations on the chart. d. Use Excel to determine the percent change between 2012 to 2022 for each discipline (not all the years in between). Percentage change = (Value final Value nitial]/Value.nitial B.S. Degrees Awarded by Discipline 40,000 y = 1622x - 3241618 35,000 30,000 2019-4048456 25,000 of BS. Degrees 20,000 15,000 y = 437x- 869712 y 102-193913 10,000 y = 701x-1402413 Y = 410-820418 5,000 y = 108.213054 D 2010 2012 2014 2015 2018 2020 2022 Year C Mechanical Aerospace JC Chemical COVE C Biomedical JC Electrical Computer ...... Linear UC Mechanica... Linear dic Chemical ..... Linear UC Biomedical . Excel Charts Project Part 3 1. Create a scatter chart with the data below as described in the Excel Chart Project handout 2. For each series name, place your initials in the name. (e.g., JC Mechanical) Data from supplement Discipline Mechanical Chemical Biomedical Electrical Computer Aerospace Civil All of Engineering 2009 17,375 5,185 3,644 9,859 11,240 3,057 10,508 60,605 2010 18,391 5,948 3,670 9,634 11,564 3,218 11,027 78,347 B.S. Degrees Awarded by Discipline 2011 2012 2013 2014 19,241 20,369 21,707 23,675 6,487 7,245 7,717 8,110 4,066 4,374 4,709 5,119 9,942 10,102 10,662 11,261 12,242 13,485 14,671 16,356 3,459 3,668 3.595 3,695 12,154 12,309 12,464 12,333 83,001 88,176 93,423 99,173 2015 25,436 9,090 5,683 11,385 19,280 3,803 11,900 106,658 2016 26,816 9,864 6,177 11,892 21,874 3,781 11,464 112,721 2017 30,030 10,973 6,725 12,893 25,013 4,050 11,920 124,477 2018 31,936 11,586 7,130 13,767 30,332 4,148 12,221 136,233 Extrapolated B.S. Graduates Numbers per Discipline Discipline 2022 Estimates Mechanical Chemical Biomedical Electrical All of Engineering 60,605 78,347 83,001 88,176 93,423 99,173 106,658 112,721 124,477 136,233 Extrapolated B.S. Graduates Numbers per Discipline Discipline 2022 Estimates Mechanical Chemical Biomedical Electrical Computer Aerospace Civil Forecast percent change from 2012 to 2022 per Discipline Discipline % Change Mechanical Chemical Biomedical Electrical Computer Aerospace Civil


