

Question: 3. Where $x_1, X_2, ldots , X_n$ is a sample from a normal distribution with unknown mean $mu$ and unknown variance $sigma^2$, the level $100(1-alpha)$%
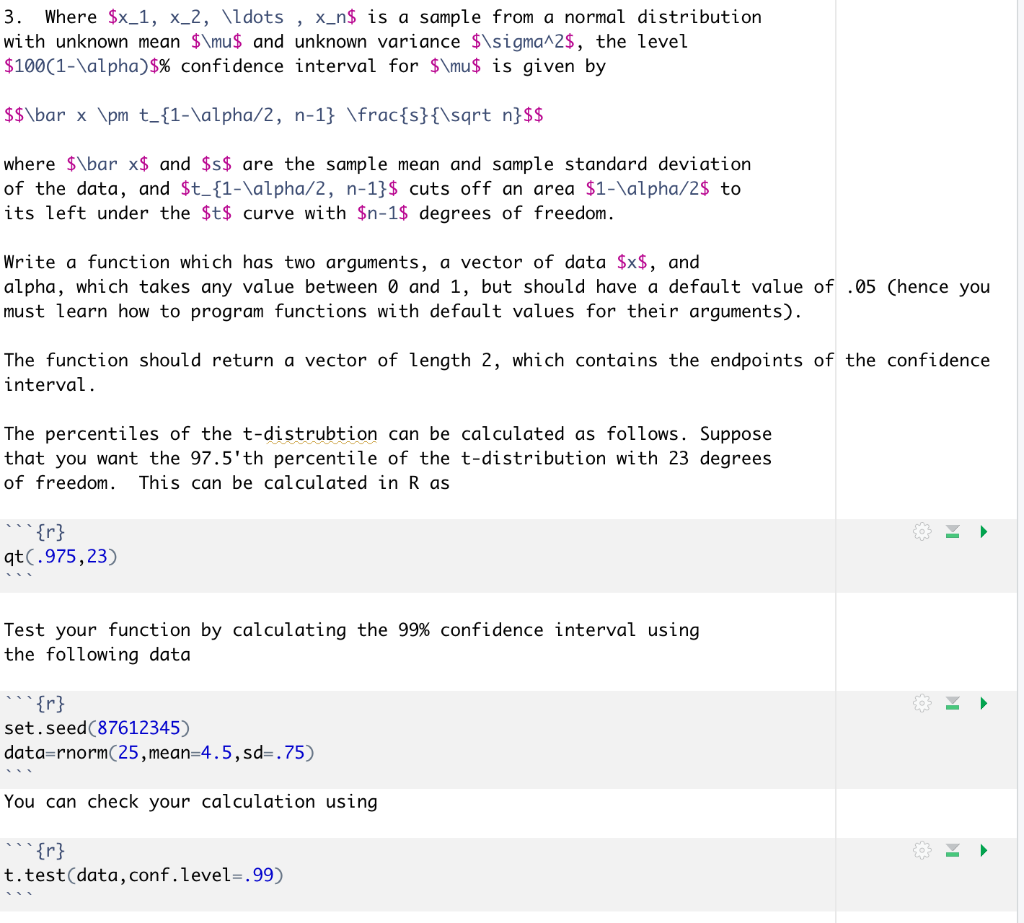
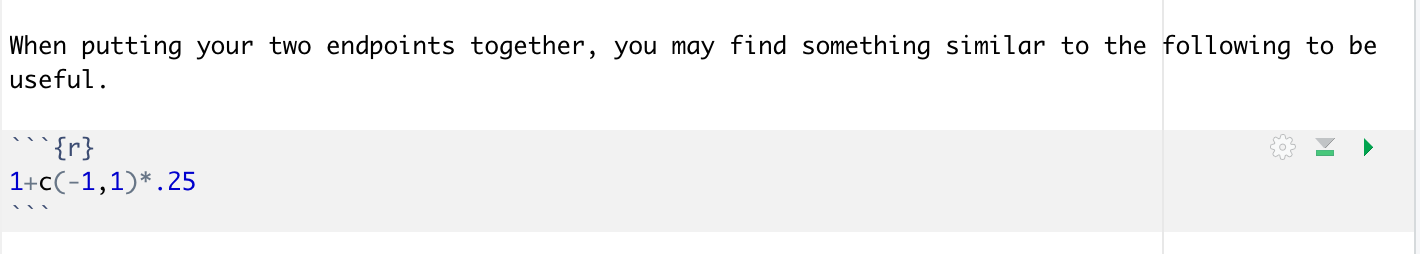
3. Where $x_1, X_2, \ldots , X_n$ is a sample from a normal distribution with unknown mean $\mu$ and unknown variance $\sigma^2$, the level $100(1-\alpha)$% confidence interval for $\mu$ is given by $$\bar x \pm t_{1-\alpha/2, n-1} \frac{s}{\sqrt n}$$ where $\bar x$ and $s$ are the sample mean and sample standard deviation of the data, and $t_{1-\alpha/2, n-1}$ cuts off an area $1-\alpha/2$ to its left under the $t$ curve with $n-1$ degrees of freedom. Write a function which has two arguments, a vector of data $x$, and alpha, which takes any value between 0 and 1, but should have a default value of .05 (hence you must learn how to program functions with default values for their arguments). The function should return a vector of length 2, which contains the endpoints of the confidence interval The percentiles of the t-distrubtion can be calculated as follows. Suppose that you want the 97.5'th percentile of the t-distribution with 23 degrees of freedom. This can be calculated in Ras {r} qt(.975,23) Test your function by calculating the 99% confidence interval using the following data {r} set.seed(87612345) data=rnorm(25, mean=4.5, sd=.75) You can check your calculation using t.test(data, conf.level=.99) When putting your two endpoints together, you may find something similar to the following to be useful. '{r} 1+C(-1,1)*.25 3. Where $x_1, X_2, \ldots , X_n$ is a sample from a normal distribution with unknown mean $\mu$ and unknown variance $\sigma^2$, the level $100(1-\alpha)$% confidence interval for $\mu$ is given by $$\bar x \pm t_{1-\alpha/2, n-1} \frac{s}{\sqrt n}$$ where $\bar x$ and $s$ are the sample mean and sample standard deviation of the data, and $t_{1-\alpha/2, n-1}$ cuts off an area $1-\alpha/2$ to its left under the $t$ curve with $n-1$ degrees of freedom. Write a function which has two arguments, a vector of data $x$, and alpha, which takes any value between 0 and 1, but should have a default value of .05 (hence you must learn how to program functions with default values for their arguments). The function should return a vector of length 2, which contains the endpoints of the confidence interval The percentiles of the t-distrubtion can be calculated as follows. Suppose that you want the 97.5'th percentile of the t-distribution with 23 degrees of freedom. This can be calculated in Ras {r} qt(.975,23) Test your function by calculating the 99% confidence interval using the following data {r} set.seed(87612345) data=rnorm(25, mean=4.5, sd=.75) You can check your calculation using t.test(data, conf.level=.99) When putting your two endpoints together, you may find something similar to the following to be useful. '{r} 1+C(-1,1)*.25
Step by Step Solution
There are 3 Steps involved in it

Get step-by-step solutions from verified subject matter experts