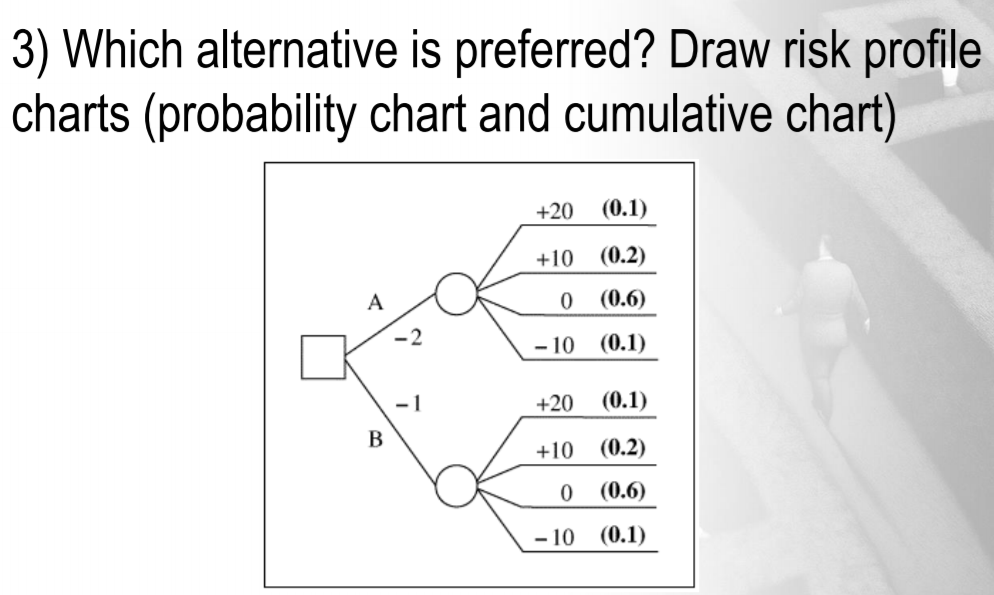
Question: 3) Which alternative is preferred? Draw risk profile charts (probability chart and cumulative chart) +20 (0.1) +10 (0.2) 0 (0.6) - 10 (0.1) -1 +20

3) Which alternative is preferred? Draw risk

3) Which alternative is preferred? Draw risk profile charts (probability chart and cumulative chart) +20 (0.1) +10 (0.2) 0 (0.6) - 10 (0.1) -1 +20 (0.1) B +10 (0.2) 0 (0.6) -10 (0.1) 3) Which alternative is preferred? Draw risk profile charts (probability chart and cumulative chart) +20 (0.1) +10 (0.2) 0 (0.6) - 10 (0.1) -1 +20 (0.1) B +10 (0.2) 0 (0.6) -10 (0.1)

Step by Step Solution

There are 3 Steps involved in it

1 Expert Approved Answer
Step: 1 Unlock blur-text-image
Question Has Been Solved by an Expert!

Get step-by-step solutions from verified subject matter experts

Step: 2 Unlock
Step: 3 Unlock

Students Have Also Explored These Related General Management Questions!