

Question: 3 Working with the (Q, R) Model A local paint store uses a (Q, R) inventory system to control its stock levels. For a
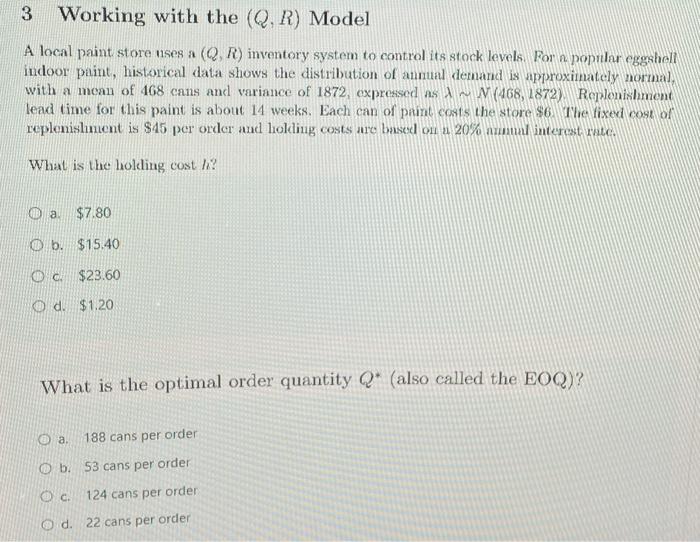
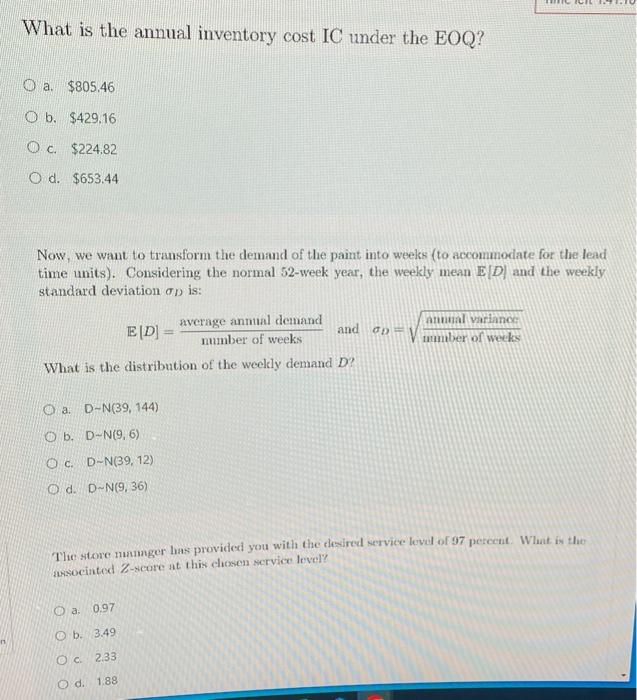
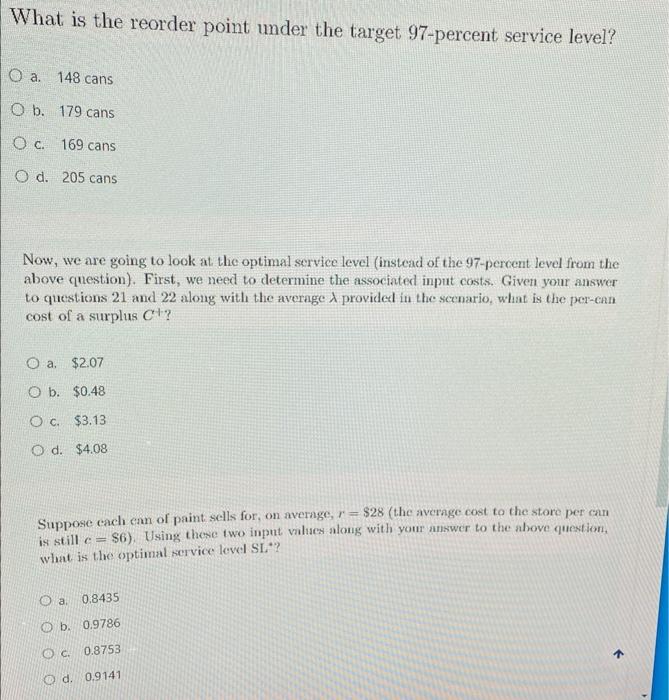
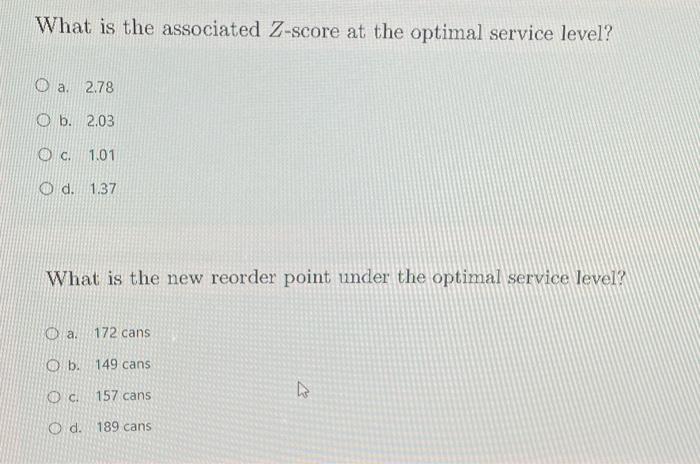
3 Working with the (Q, R) Model A local paint store uses a (Q, R) inventory system to control its stock levels. For a popular eggshell indoor paint, historical data shows the distribution of annual demand is approximately normal, with a mean of 468 cans and variance of 1872, expressed as A nu N(468, 1872) Replenishment lead time for this paint is about 14 weeks. Each can of paint costs the store $6. The fixed cost of replenishment is $45 per order and holding costs are based on a 20% ammal interest rate. What is the holding cost h? Da $7.80 Ob. $15.40 Oc. $23.60 Od. $1.20 What is the optimal order quantity Q (also called the EOQ)? a. 188 cans per order Ob. 53 cans per order OC. 124 cans per order O d. 22 cans per order What is the annual inventory cost IC under the EOQ? Oa. $805.46 O b. $429.16 O c. $224.82 Od. $653.44 Now, we want to transform the demand of the paint into weeks (to accommodate for the lead time units). Considering the normal 52-week year, the weekly mean E[D] and the weekly standard deviation op is: ED] average annual demand number of weeks annual variance and Dmber of weeks What is the distribution of the weekly demand D? O a. D-N(39, 144) Ob. D-N(9, 6) O c. D-N(39, 12) Od. D-N(9, 36) The store manager has provided you with the desired service level of 97 percent. What is the associated Z-score at this chosen service level? Oa 0.97 O b. 3.49 Oc 2.33 Od. 1.88 What is the reorder point under the target 97-percent service level? O a. 148 cans O b. 179 cans O c. 169 cans Od. 205 cans Now, we are going to look at the optimal service level (instead of the 97-percent level from the above question). First, we need to determine the associated input costs. Given your answer to questions 21 and 22 along with the average provided in the scenario, what is the per-can cost of a surplus C+? a. $2.07 O b. $0.48 O c. $3.13 O d. $4.08 Suppose each can of paint sells for, on average, r = $28 (the average cost to the store per can is still c=$6). Using these two input values along with your answer to the above question, what is the optimal service level SL*? Oa 0.8435 O b. 0.9786 O c. 0.8753 Od. 0.9141 What is the associated Z-score at the optimal service level? a. 2.78 O b. 2.03 O c. 1.01 Od. 1.37 What is the new reorder point under the optimal service level? Oa. 172 cans O b. 149 cans Oc. 157 cans Od. 189 cans
Step by Step Solution
There are 3 Steps involved in it

Get step-by-step solutions from verified subject matter experts