

Question: 3. Yield Curves: Graph A Graph B rate rate time time yield curve, which means short term a. Graph A shows a rates at than
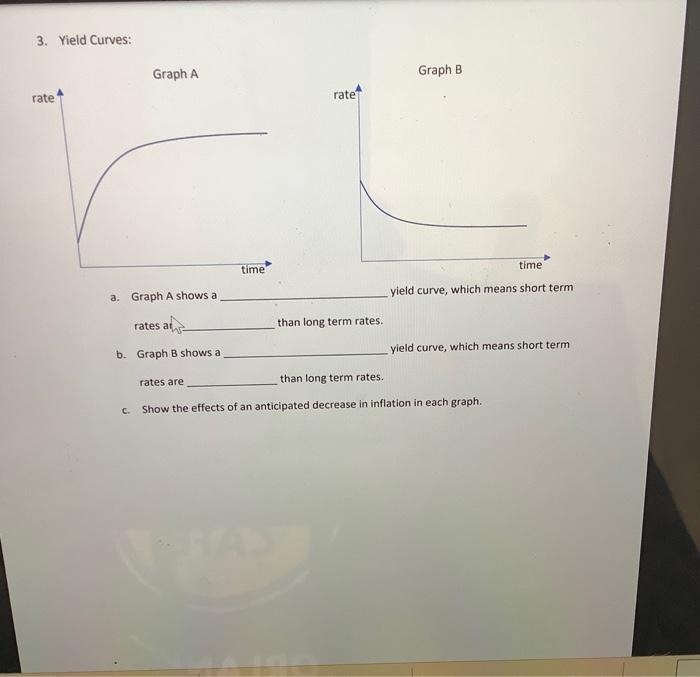
3. Yield Curves: Graph A Graph B rate rate time time yield curve, which means short term a. Graph A shows a rates at than long term rates. b. Graph B shows a yield curve, which means short term rates are than long term rates. C Show the effects of an anticipated decrease in inflation in each graph
Step by Step Solution
There are 3 Steps involved in it
1 Expert Approved Answer
Step: 1 Unlock

Question Has Been Solved by an Expert!
Get step-by-step solutions from verified subject matter experts
Step: 2 Unlock
Step: 3 Unlock