

Question: 3. You are interested in how much time students spend on the Internet each day. Here are data on the time spent on the Internet
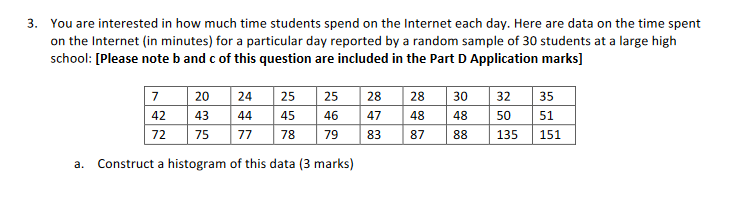
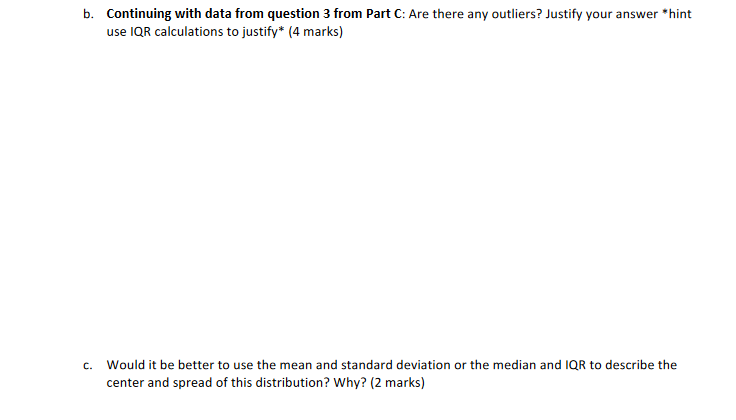
3. You are interested in how much time students spend on the Internet each day. Here are data on the time spent on the Internet {in minutes) for a particular day reported by a random sample of 30 students at a large high school: [Please note b and of this question are included in the Part D Application marks] 28 |28 (42 |43 |4 |45 |46 [a7 [48 [a8 |50 |51 | a. Construct a histogram of this data (3 marks) b. Continuing with data from question 3 from Part C: Are there any outliers? Justify your answer *hint us2 1OR calculations to justify (4 marks) c. Would it be better to use the mean and standard deviation or the median and IQR to describe the center and spread of this distribution? Why? (2 marks)
Step by Step Solution
There are 3 Steps involved in it

Get step-by-step solutions from verified subject matter experts