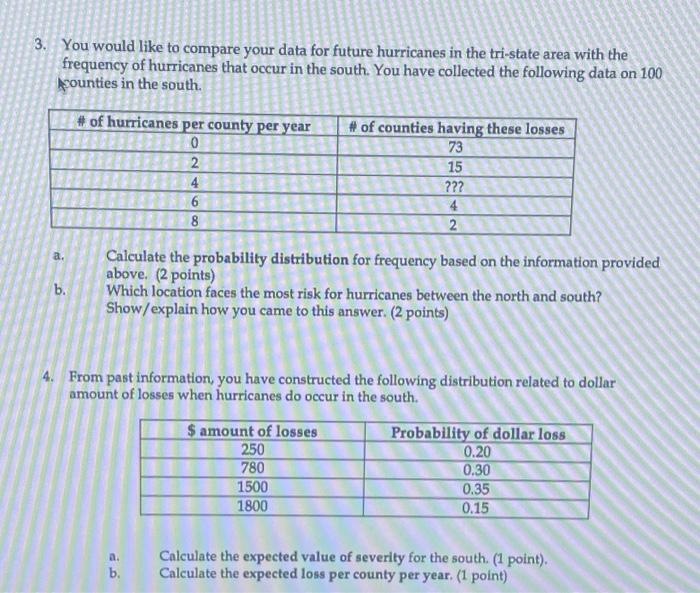
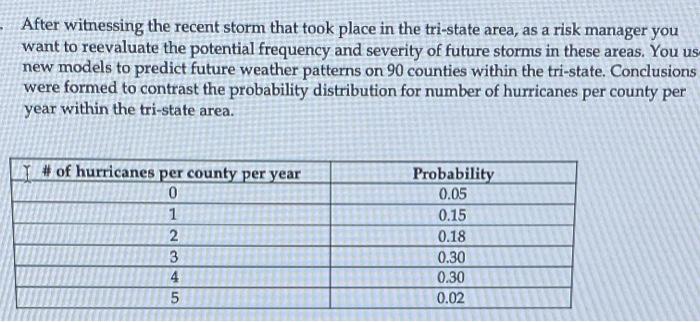
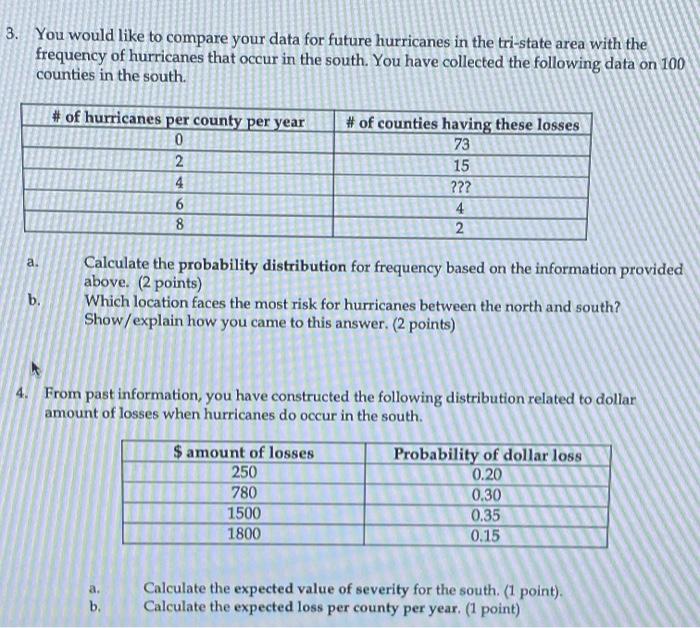
Question: 3. You would like to compare your data for future hurricanes in the tri-state area with the frequency of hurricanes that occur in the south.

3. You would like to compare your data for future
3. You would like to compare your data for future hurricanes in the tri-state area with the frequency of hurricanes that occur in the south. You have collected the following data on 100 Aounties in the south. # of hurricanes per county per year 0 2 4 6 8 # of counties having these losses 73 15 ??? 4 2 a. b. Calculate the probability distribution for frequency based on the information provided above. (2 points) Which location faces the most risk for hurricanes between the north and south? Show/explain how you came to this answer. (2 points) 4. From past information, you have constructed the following distribution related to dollar amount of losses when hurricanes do occur in the south. $ amount of losses Probability of dollar loss 250 0.20 780 0.30 1500 0.35 1800 0.15 a. b. Calculate the expected value of severity for the south (1 point). Calculate the expected loss per county per year. (1 point) After witnessing the recent storm that took place in the tri-state area, as a risk manager you want to reevaluate the potential frequency and severity of future storms in these areas. You us- new models to predict future weather patterns on 90 counties within the tri-state. Conclusions were formed to contrast the probability distribution for number of hurricanes per county per year within the tri-state area. # of hurricanes per county per year 0 1 2 3 4 5 Probability 0.05 0.15 0.18 0.30 0.30 0.02 3. You would like to compare your data for future hurricanes in the tri-state area with the frequency of hurricanes that occur in the south. You have collected the following data on 100 counties in the south. # of hurricanes per county per year 0 2 4 6 8 # of counties having these losses 73 15 ??? 4 2 a. Calculate the probability distribution for frequency based on the information provided above. (2 points) Which location faces the most risk for hurricanes between the north and south? Show/explain how you came to this answer. (2 points) b. 4. From past information, you have constructed the following distribution related to dollar amount of losses when hurricanes do occur in the south. $ amount of losses 250 780 1500 1800 Probability of dollar loss 0.20 0.30 0.35 0.15 a. b. Calculate the expected value of severity for the south. (1 point). Calculate the expected loss per county per year. (1 point)

Step by Step Solution

There are 3 Steps involved in it

1 Expert Approved Answer
Step: 1 Unlock blur-text-image
Question Has Been Solved by an Expert!

Get step-by-step solutions from verified subject matter experts

Step: 2 Unlock
Step: 3 Unlock

Students Have Also Explored These Related General Management Questions!