

Question: 30 Consider the following data drawn independently from normally distributed populations: (You may find it useful to reference the appropriate table: z table or t
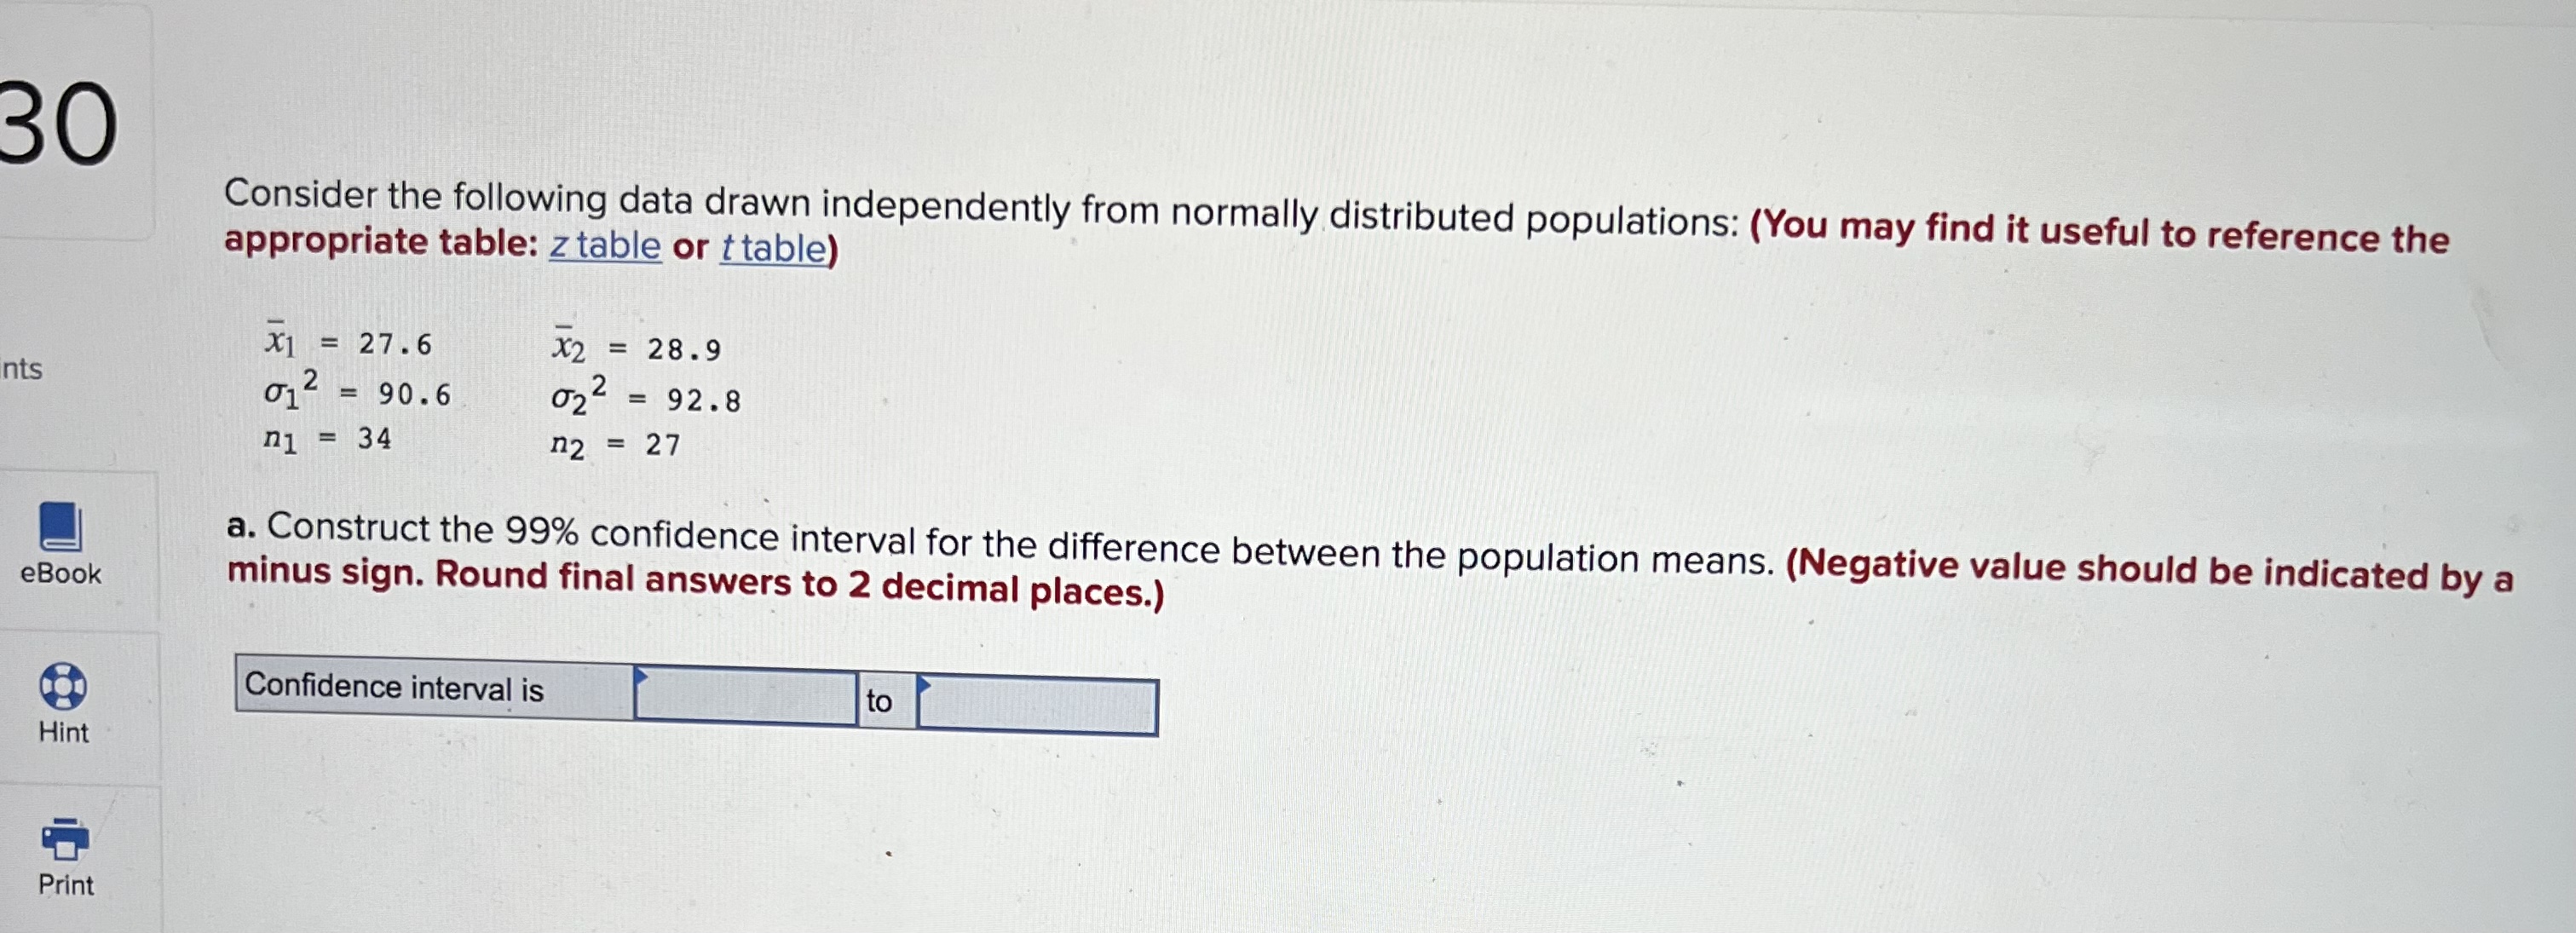
30 Consider the following data drawn independently from normally distributed populations: (You may find it useful to reference the appropriate table: z table or t table) X1 = 27 .6 X2 = 28.9 nts 01 2 = 90.6 022 = 92.8 n1 = 34 n2 = 27 a. Construct the 99% confidence interval for the difference between the population means. (Negative value should be indicated by a eBook minus sign. Round final answers to 2 decimal places.) Confidence interval is to Hint Print
Step by Step Solution
There are 3 Steps involved in it
1 Expert Approved Answer
Step: 1 Unlock

Question Has Been Solved by an Expert!
Get step-by-step solutions from verified subject matter experts
Step: 2 Unlock
Step: 3 Unlock