

Question: 30. Supernova 1987 A-Data Sheet Photograph Date Days Since Event Image Diameter (mm) Ist Measure 2nd Measure Average February 27, 1987 March 10 15 March
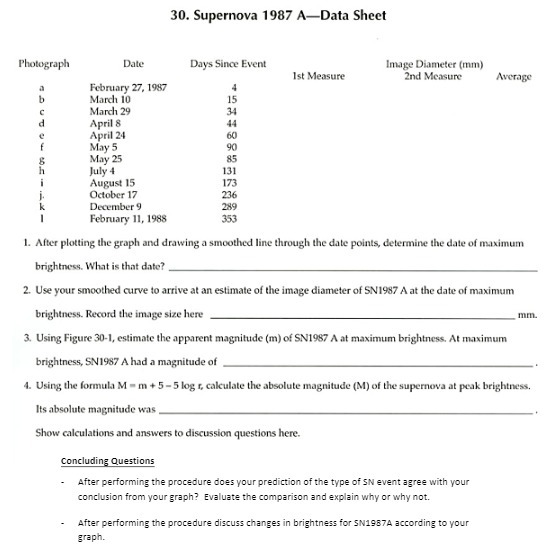
30. Supernova 1987 A-Data Sheet Photograph Date Days Since Event Image Diameter (mm) Ist Measure 2nd Measure Average February 27, 1987 March 10 15 March 29 34 April 8 44 April 24 60 May 5 90 May 25 85 July 4 131 August 15 173 October 17 236 December 9 289 February 11, 1988 353 1. After plotting the graph and drawing a smoothed line through the date points, determine the date of maximum brightness. What is that date? 2. Use your smoothed curve to arrive at an estimate of the image diameter of SN1967 A at the date of maximum brightness. Record the image size here 3. Using Figure 30-1, estimate the apparent magnitude (m) of SN1957 A at maximum brightness. At maximum brightness, SN1987 A had a magnitude of 4. Using the formula M- m +5-5 log r, calculate the absolute magnitude (M) of the supernova at peak brightness. Its absolute magnitude was Show calculations and answers to discussion questions here. Concluding Questions After performing the procedure does your prediction of the type of SN event agree with your conclusion from your graph? Evaluate the comparison and explain why or why not. After performing the procedure discuss changes in brightness for SN1987A according to your graph
Step by Step Solution
There are 3 Steps involved in it

Get step-by-step solutions from verified subject matter experts