

Question: 30. Use the table below and the network in Figure 8.19 to answer questions about the ARGOT project: Time Weekly Total Activity (wks) Cost (SK)
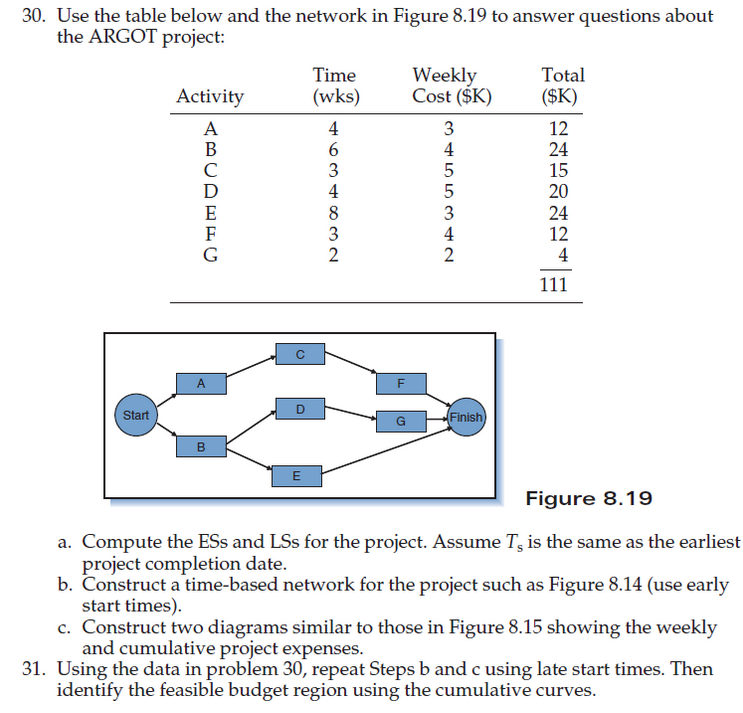
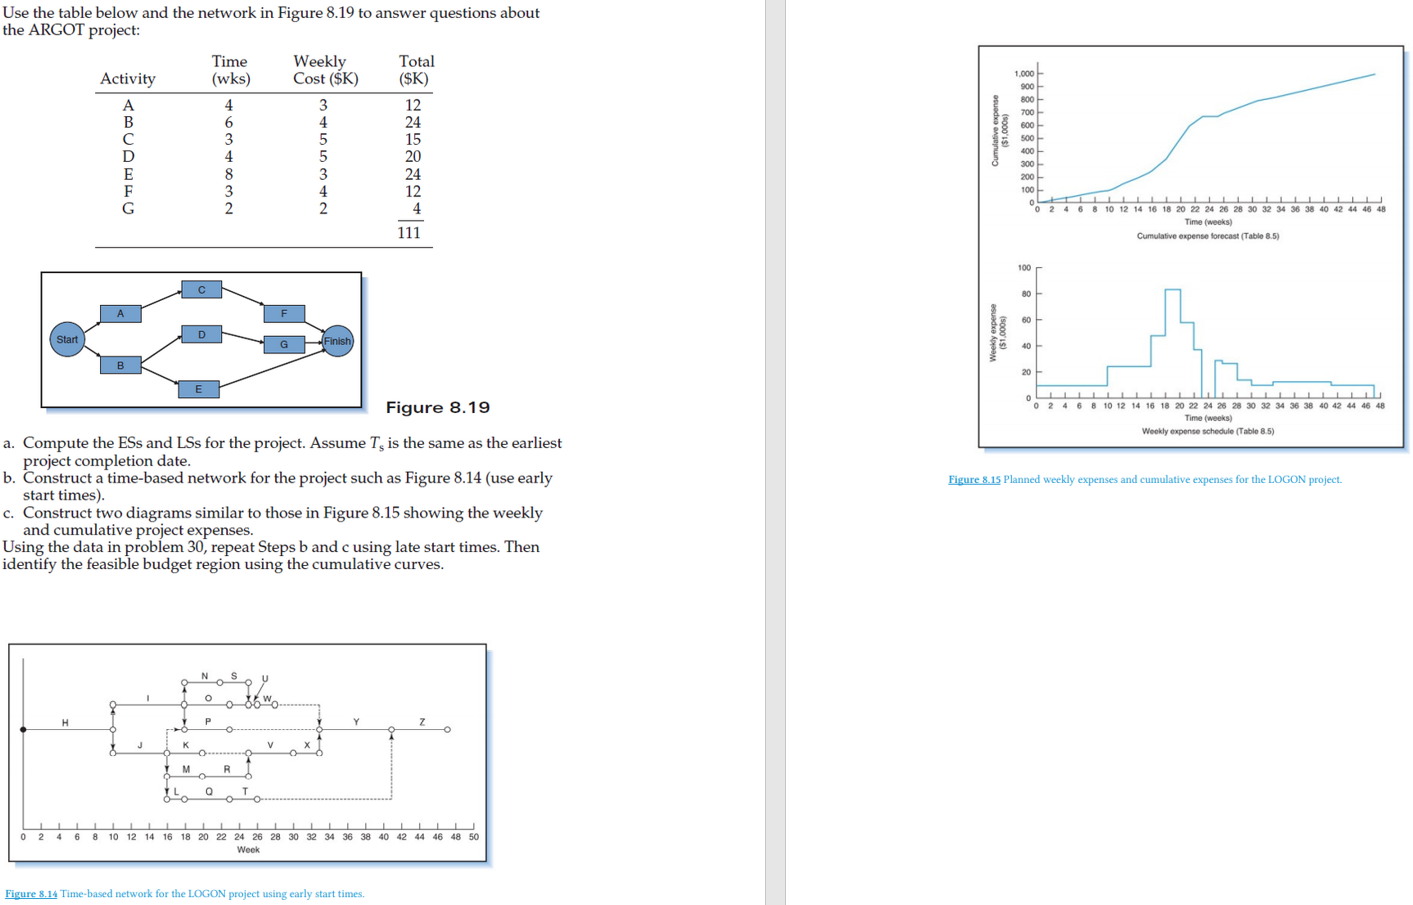
30. Use the table below and the network in Figure 8.19 to answer questions about the ARGOT project: Time Weekly Total Activity (wks) Cost (SK) (SK) A 4 3 12 B 6 4 24 3 5 15 D 4 5 20 E 8 3 F 3 4 12 G 2 2 4 111 24 F Start Finish) B E Figure 8.19 a. Compute the ESs and LSs for the project. Assume T, is the same as the earliest project completion date. b. Construct a time-based network for the project such as Figure 8.14 (use early start times). c. Construct two diagrams similar to those in Figure 8.15 showing the weekly and cumulative project expenses. 31. Using the data in problem 30, repeat Steps b and c using late start times. Then identify the feasible budget region using the cumulative curves. Use the table below and the network in Figure 8.19 to answer questions about the ARGOT project: Time Weekly Total Activity (wks) Cost (SK) ($K) A 4 3 12 B 6 4 24 3 15 D 4 5 20 E 8 3 24 F 3 4 12 G 2 2. 4 111 1.000 900 800 700 600 500 400 300 200 100 02 8 10 12 14 16 18 20 22 24 26 28 30 32 34 36 38 40 42 44 46 48 Time (weeks) Cumulative expense forecast (Table 8.5) 100 80 A F 60 D Start Finish 40 B 20 0 Figure 8.19 0 2 4 6 8 10 12 14 16 18 20 22 24 26 28 30 32 34 36 38 40 42 44 46 48 Time (weeks) Weekly expense schedule (Table 8.5) Figure 8.15 Planned weekly expenses and cumulative expenses for the LOGON project. a. Compute the ESs and LSs for the project. Assume Te is the same as the earliest project completion date. b. Construct a time-based network for the project such as Figure 8.14 (use early start times). c. Construct two diagrams similar to those in Figure 8.15 showing the weekly and cumulative project expenses. Using the data in problem 30, repeat Steps b and c using late start times. Then identify the feasible budget region using the cumulative curves. y 1 o H Y J K V 7 M R IL Q TO T 0 2 4 6 1 8 10 12 14 16 18 20 22 24 26 28 30 32 34 36 38 40 42 44 46 48 50 Week Figure 8.14 Time-based network for the LOGON project using early start times 30. Use the table below and the network in Figure 8.19 to answer questions about the ARGOT project: Time Weekly Total Activity (wks) Cost (SK) (SK) A 4 3 12 B 6 4 24 3 5 15 D 4 5 20 E 8 3 F 3 4 12 G 2 2 4 111 24 F Start Finish) B E Figure 8.19 a. Compute the ESs and LSs for the project. Assume T, is the same as the earliest project completion date. b. Construct a time-based network for the project such as Figure 8.14 (use early start times). c. Construct two diagrams similar to those in Figure 8.15 showing the weekly and cumulative project expenses. 31. Using the data in problem 30, repeat Steps b and c using late start times. Then identify the feasible budget region using the cumulative curves. Use the table below and the network in Figure 8.19 to answer questions about the ARGOT project: Time Weekly Total Activity (wks) Cost (SK) ($K) A 4 3 12 B 6 4 24 3 15 D 4 5 20 E 8 3 24 F 3 4 12 G 2 2. 4 111 1.000 900 800 700 600 500 400 300 200 100 02 8 10 12 14 16 18 20 22 24 26 28 30 32 34 36 38 40 42 44 46 48 Time (weeks) Cumulative expense forecast (Table 8.5) 100 80 A F 60 D Start Finish 40 B 20 0 Figure 8.19 0 2 4 6 8 10 12 14 16 18 20 22 24 26 28 30 32 34 36 38 40 42 44 46 48 Time (weeks) Weekly expense schedule (Table 8.5) Figure 8.15 Planned weekly expenses and cumulative expenses for the LOGON project. a. Compute the ESs and LSs for the project. Assume Te is the same as the earliest project completion date. b. Construct a time-based network for the project such as Figure 8.14 (use early start times). c. Construct two diagrams similar to those in Figure 8.15 showing the weekly and cumulative project expenses. Using the data in problem 30, repeat Steps b and c using late start times. Then identify the feasible budget region using the cumulative curves. y 1 o H Y J K V 7 M R IL Q TO T 0 2 4 6 1 8 10 12 14 16 18 20 22 24 26 28 30 32 34 36 38 40 42 44 46 48 50 Week Figure 8.14 Time-based network for the LOGON project using early start times
Step by Step Solution
There are 3 Steps involved in it

Get step-by-step solutions from verified subject matter experts