

Question: 300 400 30 | 40 | 50 | 75 11.3 14.8 15.2 7.5 Data for hydrogen are given by Dymond and Smith (1969) as, 100
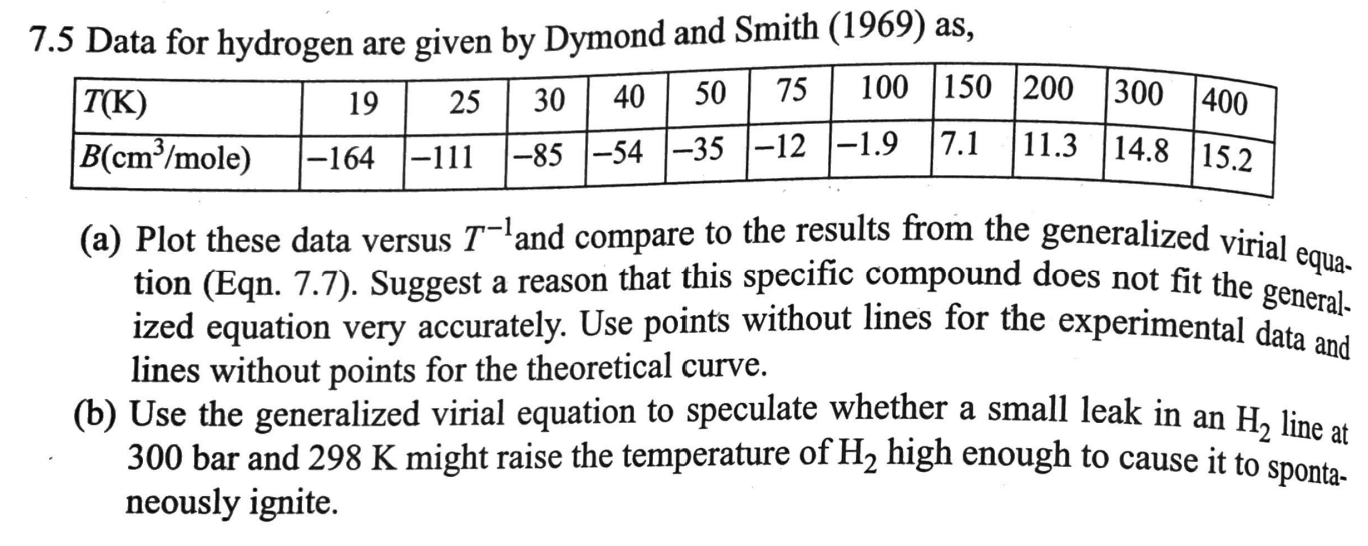
300 400 30 | 40 | 50 | 75 11.3 14.8 15.2 7.5 Data for hydrogen are given by Dymond and Smith (1969) as, 100 150 200 T(K) 19 25 B(cm/mole) |-164 |-111 1-85 -54 -35 -12 -1.9 17.1 (a) Plot these data versus T-!and compare to the results from the generalized vitial tion (Eqn. 7.7). Suggest a reason that this specific compound does not fit the general- ized equation very accurately. Use points without lines for the experimental data and lines without points for the theoretical curve. (b) Use the generalized virial equation to speculate whether a small leak in an H, line at 300 bar and 298 K might raise the temperature of H2 high enough to cause it to sponta- neously ignite. equa
Step by Step Solution
There are 3 Steps involved in it

Get step-by-step solutions from verified subject matter experts