

Question: 31 IQ test scores Figure 1 15 is a stemplot of the IQ test scores of 78 seventh grade students in a rural midwestern school

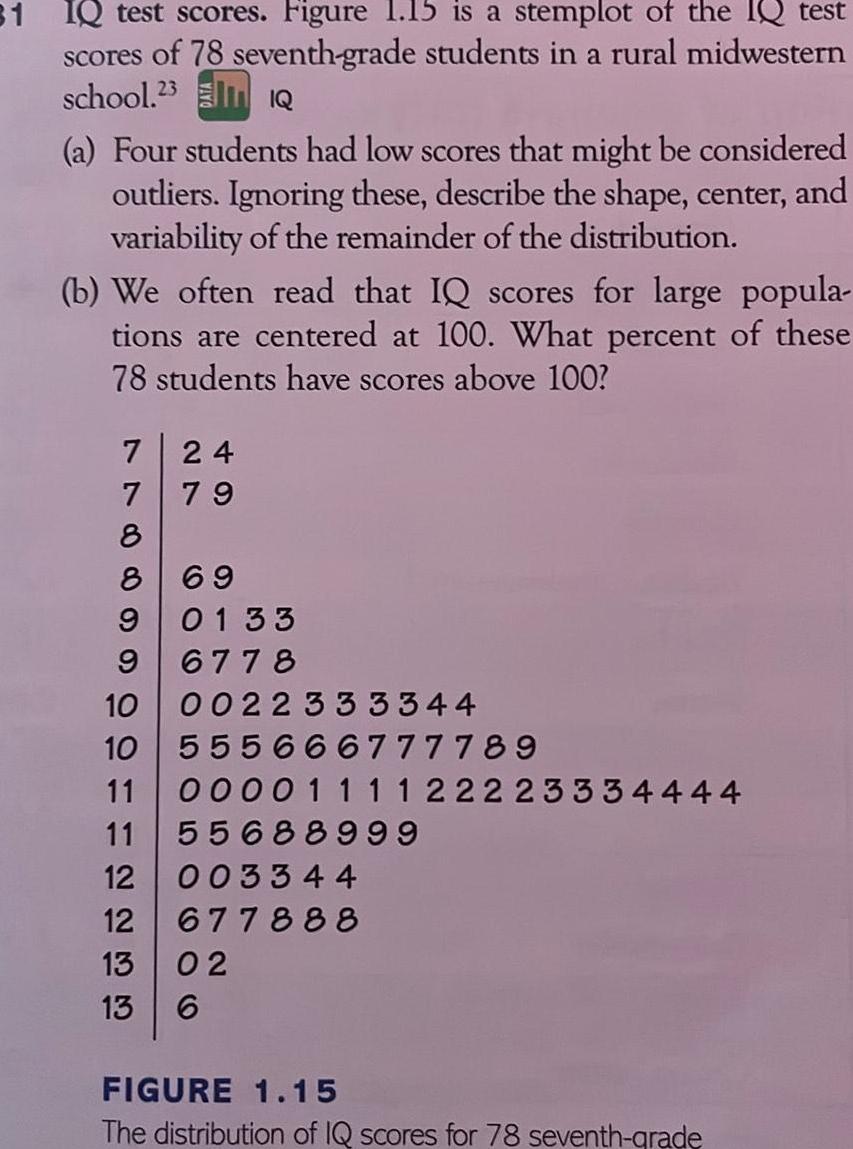
31 IQ test scores Figure 1 15 is a stemplot of the IQ test scores of 78 seventh grade students in a rural midwestern school 23 IQ a Four students had low scores that might be considered outliers Ignoring these describe the shape center and variability of the remainder of the distribution b We often read that IQ scores for large popula tions are centered at 100 What percent of these 78 students have scores above 100 7 7 8 8 69 9 0133 9 6778 0022 33 3344 24 79 10 10 11 11 55688999 12 003344 12 677888 13 02 13 6 555666777789 0 0 0 0 1 1 1 1 22223334444 FIGURE 1 15 The distribution of IQ scores for 78 seventh grade
Step by Step Solution
There are 3 Steps involved in it
1 Expert Approved Answer
Step: 1 Unlock

Question Has Been Solved by an Expert!
Get step-by-step solutions from verified subject matter experts
Step: 2 Unlock
Step: 3 Unlock