

Question: 32 32 Data Visualization Discussion There are likely a number of changes you would like to make to each of the following graphs. For this
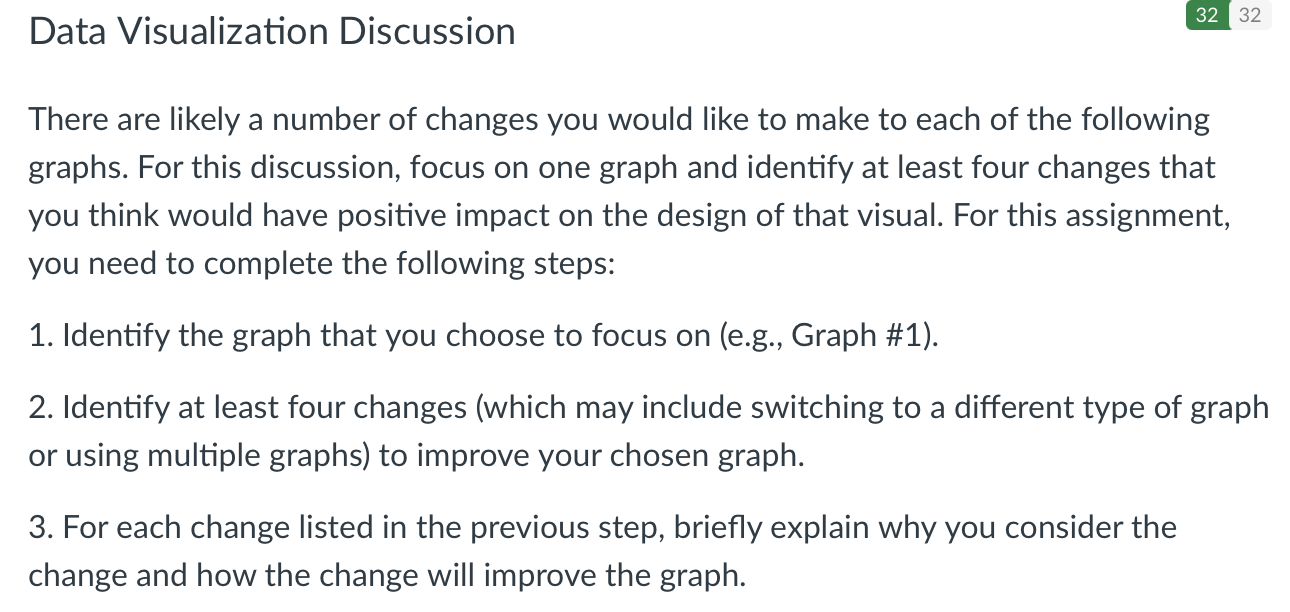
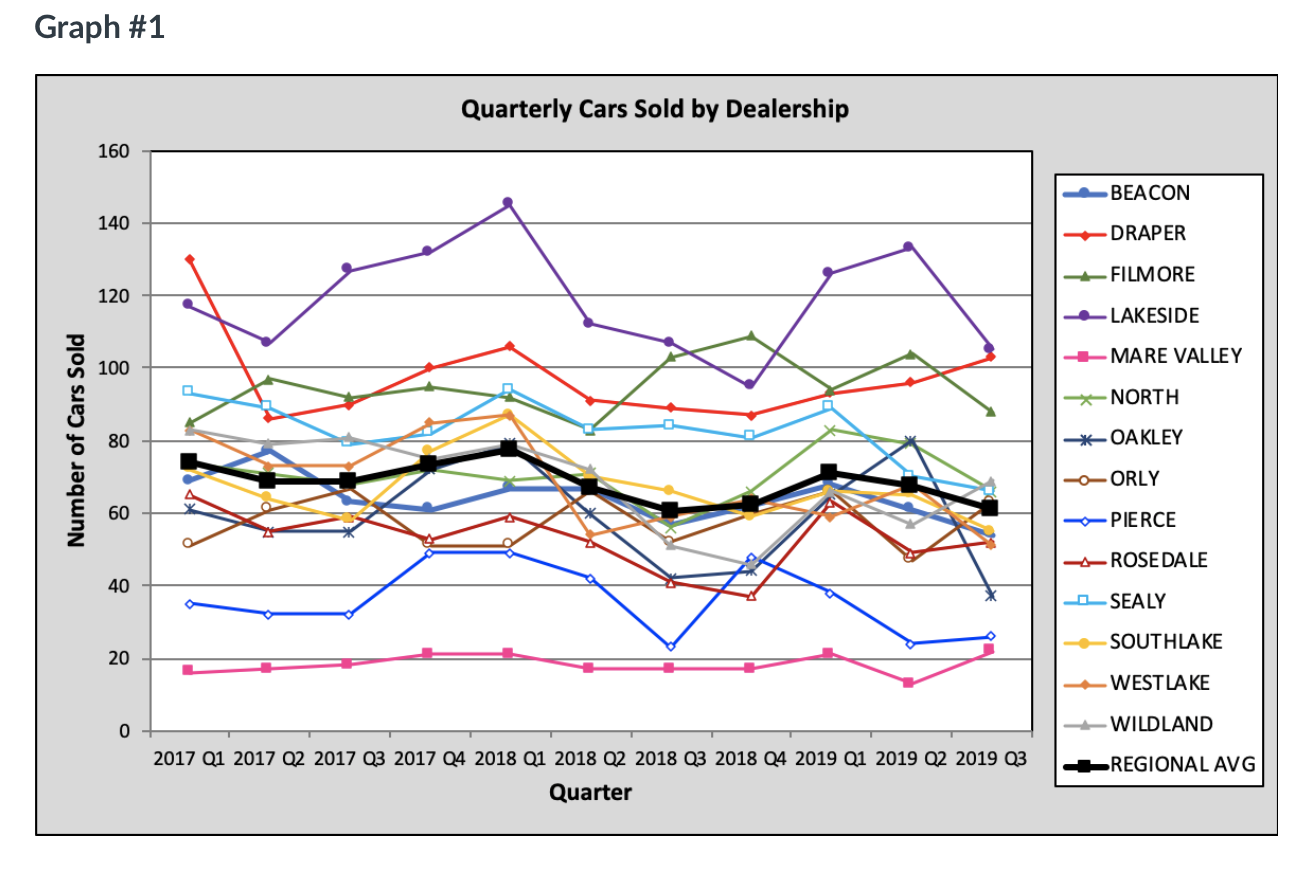

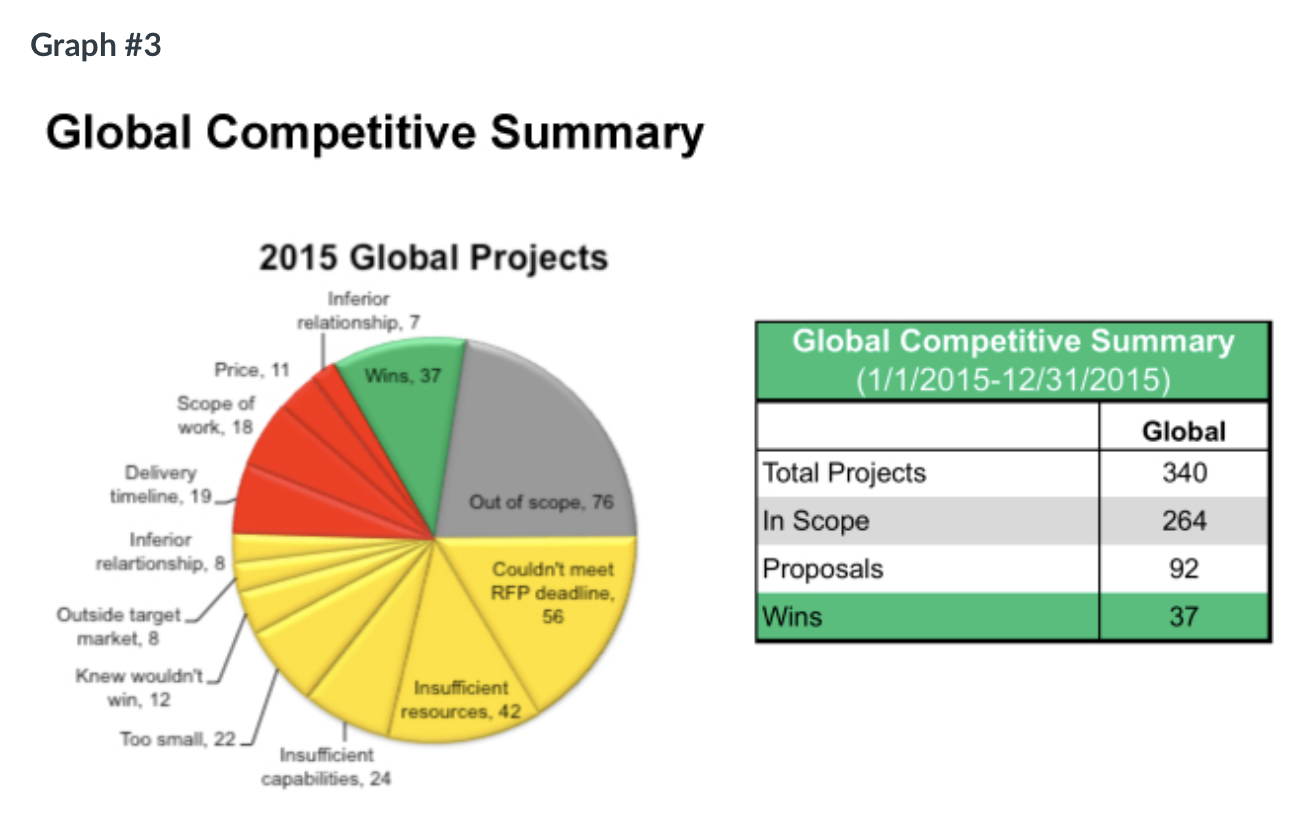
32 32 Data Visualization Discussion There are likely a number of changes you would like to make to each of the following graphs. For this discussion, focus on one graph and identify at least four changes that you think would have positive impact on the design of that visual. For this assignment, you need to complete the following steps: 1. Identify the graph that you choose to focus on (e.g., Graph #1). 2. Identify at least four changes (which may include switching to a different type of graph or using multiple graphs) to improve your chosen graph. 3. For each change listed in the previous step, briefly explain why you consider the change and how the change will improve the graph. Graph #1 160 140 120 100 80 60 40 20 Number of Cars Sold Quarterly Cars Sold by Dealership 0 2017 Q1 2017 Q2 2017 Q3 2017 Q4 2018 Q1 2018 Q2 2018 Q3 2018 Q4 2019 Q1 2019 Q2 2019 Q3 Quarter BEACON DRAPER -FILMORE LAKESIDE MARE VALLEY NORTH *-OAKLEY --ORLY -PIERCE -ROSE DA LE SEALY SOUTHLAKE WESTLAKE -WILDLAND REGIONAL AVG Graph #2 Loan Portfolio by Risk Rating $800.00 $720.00 Very High High Moderate Low Very Low Pass Grand Total $640.00 $560.00 $480.00 $400.00 $320.00 $240.00 $160.00 $80.00 $0.00 Jan-16 Feb-16 Mar-16 Apr-16 May-16 Jun-16 Jul-16 Aug-16 Sep-16 Oct-16 Nov-16 Dec-16 Jan-17 Grand Total $392.06 $407.68 $423.11 $434.66 $467.64 $501.23 $517.65 $554.71 $574.08 $595.25 $605.53 $662.97 $709.10 Pass $348.02 $361.90 $376.91 $391.66 $421.54 $456.14 $472.58 $508.66 $529.36 $557.93 $566.61 $625.54 $671.61 Very Low $30.57 $32.92 $33.69 $31.10 $33.31 $32.32 $32.30 $29.80 $29.78 $22.60 $22.59 $20.30 $20.37 Low $10.71 $10.70 $10.36 $10.35 $10.34 $10.33 $10.33 $10.33 $9.17 $9.18 $9.18 $10.20 $10.18 Moderate $1.84 $1.33 $2.33 $2.32 $2.32 $5.80 $5.65 $6.07 $0.05 $0.05 $0.05 $0.05 $0.05 $1.32 $1.33 $4.78 $6.37 $6.09 High $0.76 $0.15 $0.70 $0.72 $0.78 $0.81 $0.85 $0.76 $0.07 $0.07 $0.07 $0.07 Very High $0.07 $0.07 $0.07 $0.07 $0.07 $0.06 $0.06 $0.06 $0.06 Millions $ Graph #3 Global Competitive Summary 2015 Global Projects Inferior relationship, 7 Out of scope, 76 Couldn't meet RFP deadline, 56 Scope of work, 18 Price, 11 Delivery timeline, 19 Inferior relationship, 8 Outside target. market, 8 Knew wouldn't. win, 12 Too small, 22 Wins, 37 Insufficient capabilities, 24 Insufficient resources, 42 Global Competitive Summary (1/1/2015-12/31/2015) Global Total Projects 340 In Scope 264 Proposals 92 Wins 37 Graph #4 0.50% 0.00% -0.50% -1.00% -1.50% -2.00% -2.50% -3.00% -3.50% -4.00% -4.50% -5.00% Region 1 Region 7 -3.62% Customer Count Tracking All Regions Region 2 Region 8 0.29% -1.09% Region 3 Region 4 Region 5 Region 6 Region 9 0.05% -3.07% -1.96% -1.45% -1.69% 32 32 Data Visualization Discussion There are likely a number of changes you would like to make to each of the following graphs. For this discussion, focus on one graph and identify at least four changes that you think would have positive impact on the design of that visual. For this assignment, you need to complete the following steps: 1. Identify the graph that you choose to focus on (e.g., Graph #1). 2. Identify at least four changes (which may include switching to a different type of graph or using multiple graphs) to improve your chosen graph. 3. For each change listed in the previous step, briefly explain why you consider the change and how the change will improve the graph. Graph #1 160 140 120 100 80 60 40 20 Number of Cars Sold Quarterly Cars Sold by Dealership 0 2017 Q1 2017 Q2 2017 Q3 2017 Q4 2018 Q1 2018 Q2 2018 Q3 2018 Q4 2019 Q1 2019 Q2 2019 Q3 Quarter BEACON DRAPER -FILMORE LAKESIDE MARE VALLEY NORTH *-OAKLEY --ORLY -PIERCE -ROSE DA LE SEALY SOUTHLAKE WESTLAKE -WILDLAND REGIONAL AVG Graph #2 Loan Portfolio by Risk Rating $800.00 $720.00 Very High High Moderate Low Very Low Pass Grand Total $640.00 $560.00 $480.00 $400.00 $320.00 $240.00 $160.00 $80.00 $0.00 Jan-16 Feb-16 Mar-16 Apr-16 May-16 Jun-16 Jul-16 Aug-16 Sep-16 Oct-16 Nov-16 Dec-16 Jan-17 Grand Total $392.06 $407.68 $423.11 $434.66 $467.64 $501.23 $517.65 $554.71 $574.08 $595.25 $605.53 $662.97 $709.10 Pass $348.02 $361.90 $376.91 $391.66 $421.54 $456.14 $472.58 $508.66 $529.36 $557.93 $566.61 $625.54 $671.61 Very Low $30.57 $32.92 $33.69 $31.10 $33.31 $32.32 $32.30 $29.80 $29.78 $22.60 $22.59 $20.30 $20.37 Low $10.71 $10.70 $10.36 $10.35 $10.34 $10.33 $10.33 $10.33 $9.17 $9.18 $9.18 $10.20 $10.18 Moderate $1.84 $1.33 $2.33 $2.32 $2.32 $5.80 $5.65 $6.07 $0.05 $0.05 $0.05 $0.05 $0.05 $1.32 $1.33 $4.78 $6.37 $6.09 High $0.76 $0.15 $0.70 $0.72 $0.78 $0.81 $0.85 $0.76 $0.07 $0.07 $0.07 $0.07 Very High $0.07 $0.07 $0.07 $0.07 $0.07 $0.06 $0.06 $0.06 $0.06 Millions $ Graph #3 Global Competitive Summary 2015 Global Projects Inferior relationship, 7 Out of scope, 76 Couldn't meet RFP deadline, 56 Scope of work, 18 Price, 11 Delivery timeline, 19 Inferior relationship, 8 Outside target. market, 8 Knew wouldn't. win, 12 Too small, 22 Wins, 37 Insufficient capabilities, 24 Insufficient resources, 42 Global Competitive Summary (1/1/2015-12/31/2015) Global Total Projects 340 In Scope 264 Proposals 92 Wins 37 Graph #4 0.50% 0.00% -0.50% -1.00% -1.50% -2.00% -2.50% -3.00% -3.50% -4.00% -4.50% -5.00% Region 1 Region 7 -3.62% Customer Count Tracking All Regions Region 2 Region 8 0.29% -1.09% Region 3 Region 4 Region 5 Region 6 Region 9 0.05% -3.07% -1.96% -1.45% -1.69%
Step by Step Solution
There are 3 Steps involved in it

Get step-by-step solutions from verified subject matter experts