

Question: 3.3 M-file to Generate One Sinusoid Write a function that will generate a single sinusoid, x(t) = A cos(2n ft + y). The function should
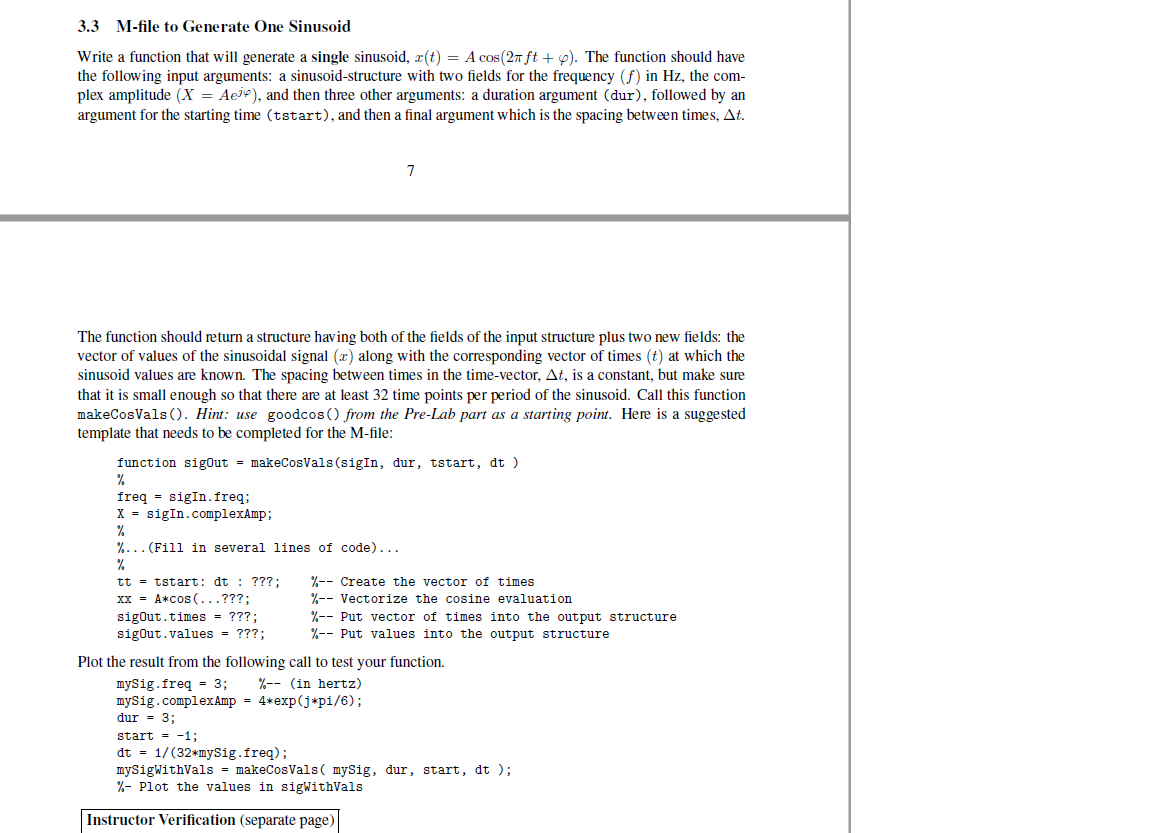
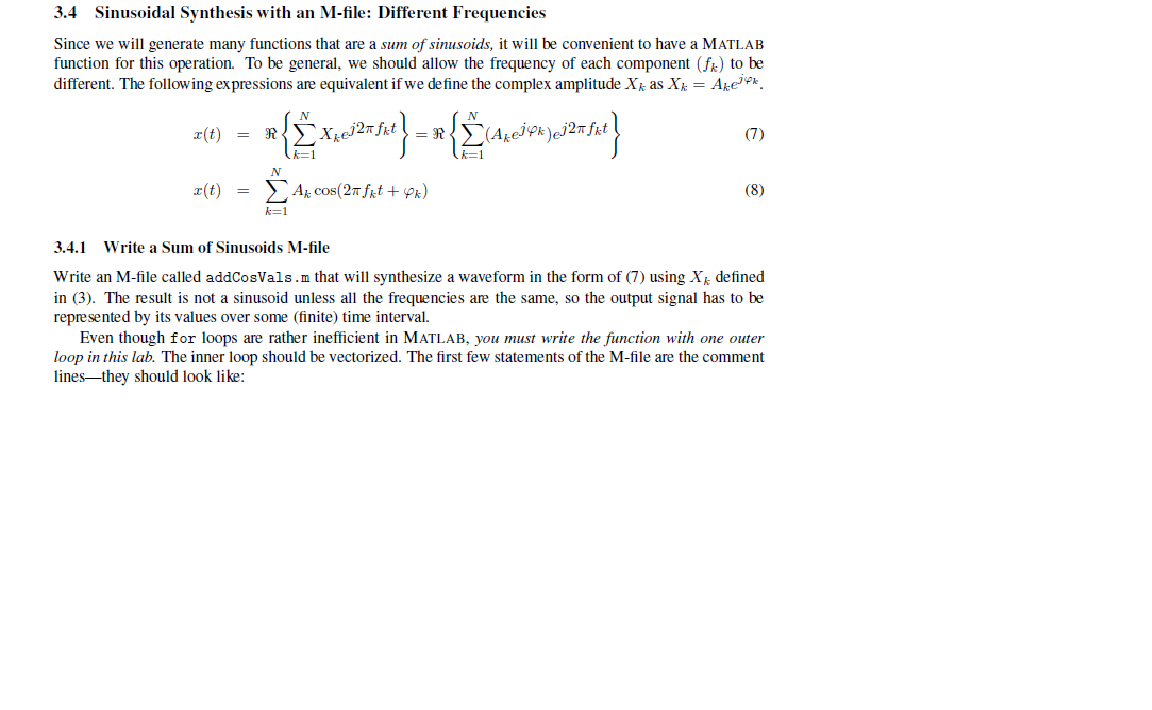
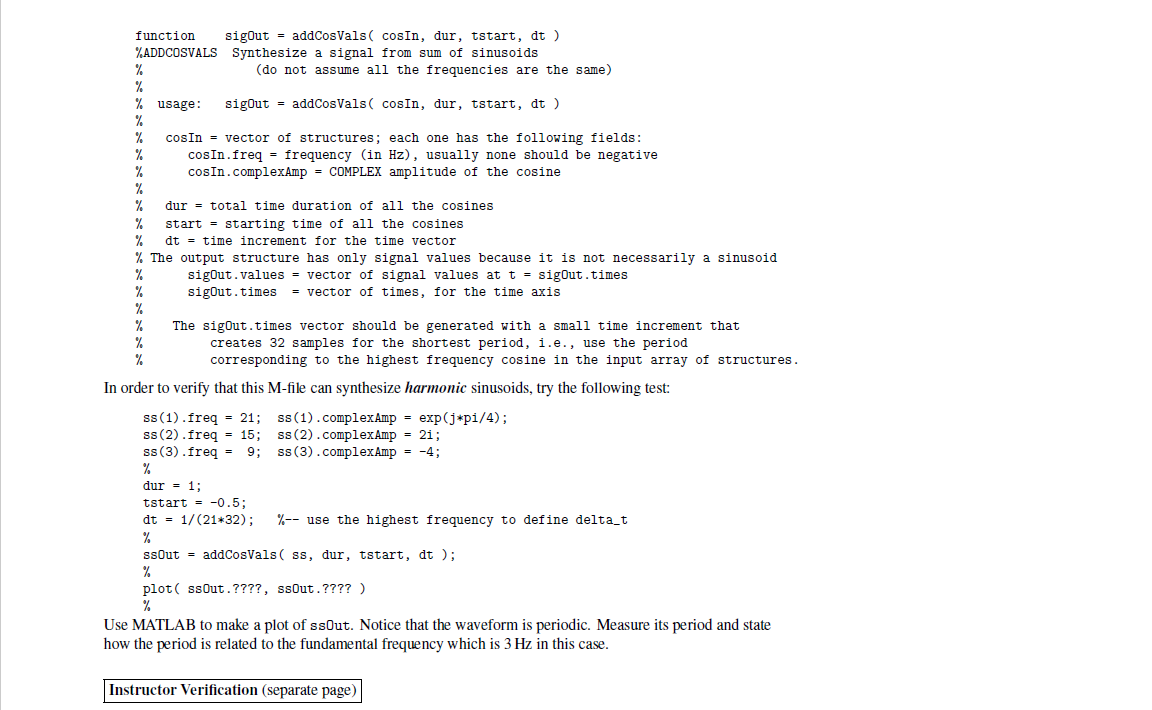
3.3 M-file to Generate One Sinusoid Write a function that will generate a single sinusoid, x(t) = A cos(2n ft + y). The function should have the following input arguments: a sinusoid-structure with two fields for the frequency (f) in Hz, the com- plex amplitude (X = Aej9), and then three other arguments: a duration argument (dur), followed by an argument for the starting time (tstart), and then a final argument which is the spacing between times, At. The function should return a structure having both of the fields of the input structure plus two new fields: the vector of values of the sinusoidal signal (x) along with the corresponding vector of times (t) at which the sinusoid values are known. The spacing between times in the time-vector, At, is a constant, but make sure that it is small enough so that there are at least 32 time points per period of the sinusoid. Call this function makeCosVals (). Hint: use goodcos () from the Pre-Lab part as a starting point. Here is a suggested template that needs to be completed for the M-file: function sigout = makeCosVals (sigIn, dur, tstart, dt ) freq = sigIn.freq; X = sigIn.complexAmp; %... (Fill in several lines of code)... %-- Create the vector of times tt = tstart: dt : ???; XX = A*cos (...???; %-- Vectorize the cosine evaluation %-- Put vector of times into the output structure %-- Put values into the output structure sigout.times = ???; sigout.values = ???; Plot the result from the following call to test your function. mySig.freq = 3; mySig.complexAmp = 4*exp(j*pi/6); dur = 3; %-- (in hertz) start = -%3B dt = 1/(32+mySig.freq); mySigWithVals = makeCosVals( mySig, dur, start, dt ); %- Plot the values in sigWithVals Instructor Verification (separate page) 3.4 Sinusoidal Synthesis with an M-file: Different Frequencies Since we will generate many functions that are a sum of sinusoids, it will be convenient to have a MATLAB function for this operation. To be general, we should allow the frequency of each component (fr) to be different. The following expressions are equivalent if we de fine the complex amplitude Xk as X = Ake"k. R Xe2 frt = R x(t) (7) k=1 A cos(27 frt + Pk) x(t) (8) k=1 3.4.1 Write a Sum of Sinusoids M-file Write an M-file called addCosVals.m that will synthesize a waveform in the form of (7) using X defined in (3). The result is not a sinusoid unless all the frequencies are the same, so the output signal has to be represented by its values over some (finite) time interval. Even though for loops are rather inefficient in MATLAB, you must write the function with one outer loop in this lab. The inner loop should be vectorized. The first few statements of the M-file are the comment lines-they should look li ke: sigout = addCosVals( cosIn, dur, tstart, dt ) %ADDCOSVALS Synthesize a signal from sum of sinusoids function (do not assume all the frequencies are the same) sigout = addCosVals( cosIn, dur, tstart, dt ) usage: cosIn = vector of structures; each one has the following fields: cosIn.freq = frequency (in Hz), usually none should be negative cosIn.complexAmp = COMPLEX amplitude of the cosine dur = total time duration of all the cosines start = starting time of all the cosines dt time increment for the time vector % The output structure has only signal values because it is not necessarily a sinusoid sigout.values = vector of signal values at t = sig0ut.times sigout.times = vector of times, for the time axis The sigOut.times vector should be generated with a small time increment that creates 32 samples for the shortest period, i.e., use the period corresponding to the highest frequency cosine in the input array of structures. In order to verify that this M-file can synthesize harmonic sinusoids, try the following test: ss (1).freq = 21; ss(1).complexAmp = exp(j*pi/4); ss (2).freq = 15; ss(2).complexAmp = 21; ss (3).freq = 9; ss(3).complexAmp = -4; dur = 1; tstart - -0.5%; dt = 1/(21*32); %-- use the highest frequency to define delta_t ssout = addCosVals ( ss, dur, tstart, dt ); plot ( ssout.????, ssout.???? ) Use MATLAB to make a plot of ssOut. Notice that the waveform is periodic. Measure its period and state how the period is related to the fundamental frequency which is 3 Hz in this case. Instructor Verification (separate page)
Step by Step Solution
There are 3 Steps involved in it

Get step-by-step solutions from verified subject matter experts