

Question: 3.4 Model Assumptions In the advertising-sales example presented in Section 3.3, we assumed that the probabilistic model relating the firm's sales revenue y to advertising
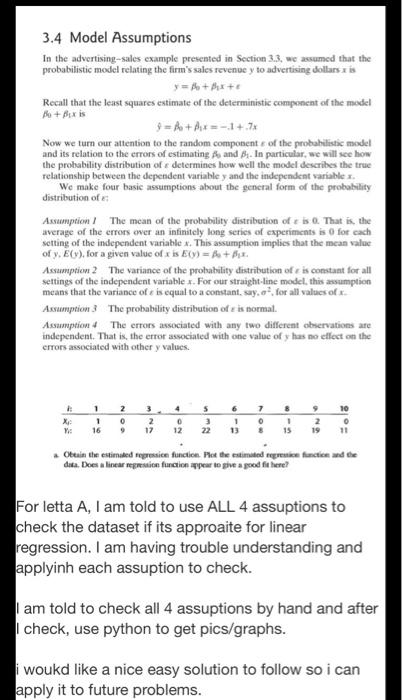
3.4 Model Assumptions In the advertising-sales example presented in Section 3.3, we assumed that the probabilistic model relating the firm's sales revenue y to advertising dollars is y = 8 + x + Recall that the least squares estimate of the deterministic component of the model Be + Bexis P = A + dex=-1+.74 Now we turn our attention to the random components of the probabilistic model and its relation to the errors of estimating A and Bs. In particular, we will see how the probability distribution of determines how well the model describes the true relationship between the dependent variable y and the independent variables. We make four basic assumptions about the general form of the probability distribution of Assumption / The mean of the probability distribution of is 0. That is the average of the errors over an infinitely long series of experiments is for each setting of the independent variable. This assumption implies that the mean value of y, E(y), for a given value of x is E(y) = A + Bux Assumptien 2 The variance of the probability distribution of is constant for all settings of the independent variable. For our straight-line model this assumption means that the variance of is equal to a constant, say. o for all values of Assumption 3 The probability distribution of is normal. AssumptionThe errors associated with any two different observations are independent. That is the error associated with one value of y has no effect on the crrors associated with other y values. 6 1 1 16 2 0 3 2 17 4 0 12 5 3 22 7 o 1 13 1 15 2 19 10 o 11 Obtain the estimated regressice function Phot the estimated regie function and the data. Does a linear regression function appear to give a good fit here? For letta A, I am told to use ALL 4 assuptions to check the dataset if its approaite for linear regression. I am having trouble understanding and applyinh each assuption to check. am told to check all 4 assuptions by hand and after check, use python to get pics/graphs. i woukd like a nice easy solution to follow so i can apply it to future problems. 3.4 Model Assumptions In the advertising-sales example presented in Section 3.3, we assumed that the probabilistic model relating the firm's sales revenue y to advertising dollars is y = 8 + x + Recall that the least squares estimate of the deterministic component of the model Be + Bexis P = A + dex=-1+.74 Now we turn our attention to the random components of the probabilistic model and its relation to the errors of estimating A and Bs. In particular, we will see how the probability distribution of determines how well the model describes the true relationship between the dependent variable y and the independent variables. We make four basic assumptions about the general form of the probability distribution of Assumption / The mean of the probability distribution of is 0. That is the average of the errors over an infinitely long series of experiments is for each setting of the independent variable. This assumption implies that the mean value of y, E(y), for a given value of x is E(y) = A + Bux Assumptien 2 The variance of the probability distribution of is constant for all settings of the independent variable. For our straight-line model this assumption means that the variance of is equal to a constant, say. o for all values of Assumption 3 The probability distribution of is normal. AssumptionThe errors associated with any two different observations are independent. That is the error associated with one value of y has no effect on the crrors associated with other y values. 6 1 1 16 2 0 3 2 17 4 0 12 5 3 22 7 o 1 13 1 15 2 19 10 o 11 Obtain the estimated regressice function Phot the estimated regie function and the data. Does a linear regression function appear to give a good fit here? For letta A, I am told to use ALL 4 assuptions to check the dataset if its approaite for linear regression. I am having trouble understanding and applyinh each assuption to check. am told to check all 4 assuptions by hand and after check, use python to get pics/graphs. i woukd like a nice easy solution to follow so i can apply it to future problems
Step by Step Solution
There are 3 Steps involved in it

Get step-by-step solutions from verified subject matter experts