

Question: 34. See Table 2.5 showing financial statement data and stock price data for Mydeco Corp. a. How did Mydeco's book debt-equity ratio change from 2009
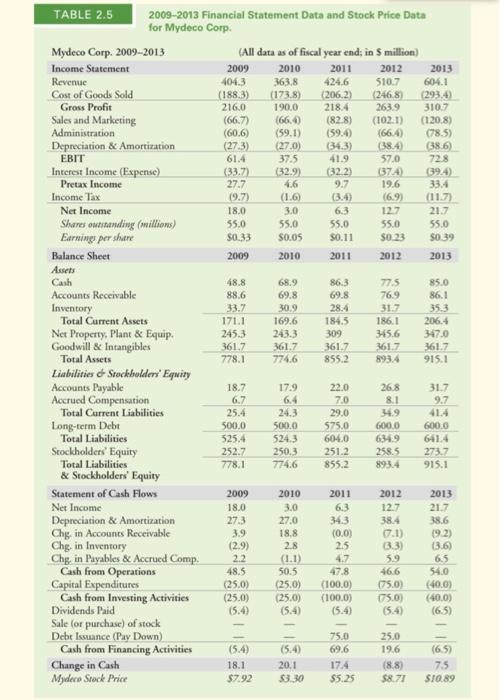
34. See Table 2.5 showing financial statement data and stock price data for Mydeco Corp. a. How did Mydeco's book debt-equity ratio change from 2009 to 2013 b. How did Mydeco's market debt-equity ratio change from 2009 to 2013? c. Compute Mydeco's debt-to-enterprise value ratio to assess how the fraction of its business that is debt financed has changed over the period. 4.6 9.7 217 76.9 TABLE 2.5 2009-2013 Financial Statement Data and Stock Price Data for Mydeco Corp. Mydeco Corp. 2009-2013 (All data as of fiscal year end; in 5 million) Income Statement 2009 2010 2011 2012 2013 Revenue 404.3 363.8 4246 510.7 604.1 Cost of Goods Sold (1883) (1738) (206.2) (246.8 (293.4) Gross Profit 216.0 190.0 218.4 263.9 310.7 Sales and Marketing (66.7 (66.6 (82.8) (1021) (120.8) Administration (60.6) (59.1) (59.4 (66.4 078.5) Depreciation & Amortization (273) (270) (34.3) (384) 386) EBIT 61.4 37.5 41.9 57.0 72.8 Interest Income (Expense) (33.7 (32.9) (32.2) (374) (394) Pretax Income 27.7 19.6 33.4 Income Tax (9.7) (1.6) (3.4) (6.9 Net Income 18.0 3.0 6.3 12.7 Shares outstanding (willions 55.0 55.0 55.0 55.0 55.0 Earnings per shere $0.33 S0.05 30.11 $0.23 $0.39 Balance Sheet 2009 2010 2011 2012 2013 Assets Cash 48.8 68.9 86,3 77.5 85.0 Accounts Receivable 88.6 69.8 69.8 86.1 Inventory 33.7 30.9 28.4 31.7 35.3 Total Current Assets 171.1 169.6 184.5 186.1 206.4 Net Property, Plant & Equip 245.3 243.3 309 345.6 347.0 Goodwill & Intangibles 361.7 3617 361.7 361.7 361.7 Total Assets 778.1 774.6 855.2 8934 915.1 Liabilities - Stockholders' Equity Accounts Payable 18.7 17.9 22.0 26.8 31.7 Accrued Compensation 6.7 6.4 70 8.1 9.7 Total Current Liabilities 25.4 24.3 29.0 41.4 Long-term Debt 500.0 500.0 575.0 600.0 600.0 Total Liabilities 525.4 524.3 604.0 634.9 641.4 Stockholders' Equity 252.7 250.3 251.2 2585 273.7 Total Liabilities 778.1 7746 855.2 893.4 915.1 & Stockholders' Equity Statement of Cash Flows 2009 2010 2011 2012 2013 Net Income 18.0 3.0 6.3 12.7 21.7 Depreciation & Amortization 27.3 27.0 343 38.4 Chg in Accounts Receivable 3.9 18.8 (0.03 07.1) (92) Chg. in Inventory (2.9) 2.8 2.5 3.3) (3.6 Chg, in Payables & Accrued Comp. 2.2 (1.1) 4.7 5.9 6.5 Cash from Operations 48.5 50.5 47.8 46.6 54.0 Capital Expenditures (25.00 (25.0) (1000) 075.0) (400) Cash from Investing Activities (25.0) (25.0) (100.0) 05.0) (40.0) Dividends Paid (5.4) (5.4) (6.5) Sale for purchase) of stock Debt Issuance (Pay Down) 75.0 25.0 Cash from Financing Activities (5.4) (5.4) 69.6 19.6 (65) Change in Cash 18.1 20.1 17.4 (88) 7.5 Mydeco Stock Price $7.92 8.30 $5.25 $8.77 SI0.89
Step by Step Solution
There are 3 Steps involved in it

Get step-by-step solutions from verified subject matter experts