

Question: 34. Using 3-sigma limits, calculate the LCL and UCL for these data. a. UCL=.4942;LCL=0 b. UCL=.4742;LCL=0 c. UCL=.231;LCL=0.219 d. UCL=.245;LCL=0.203 e. UCL=.266;LCL=0.222 QUESTION 35 35.
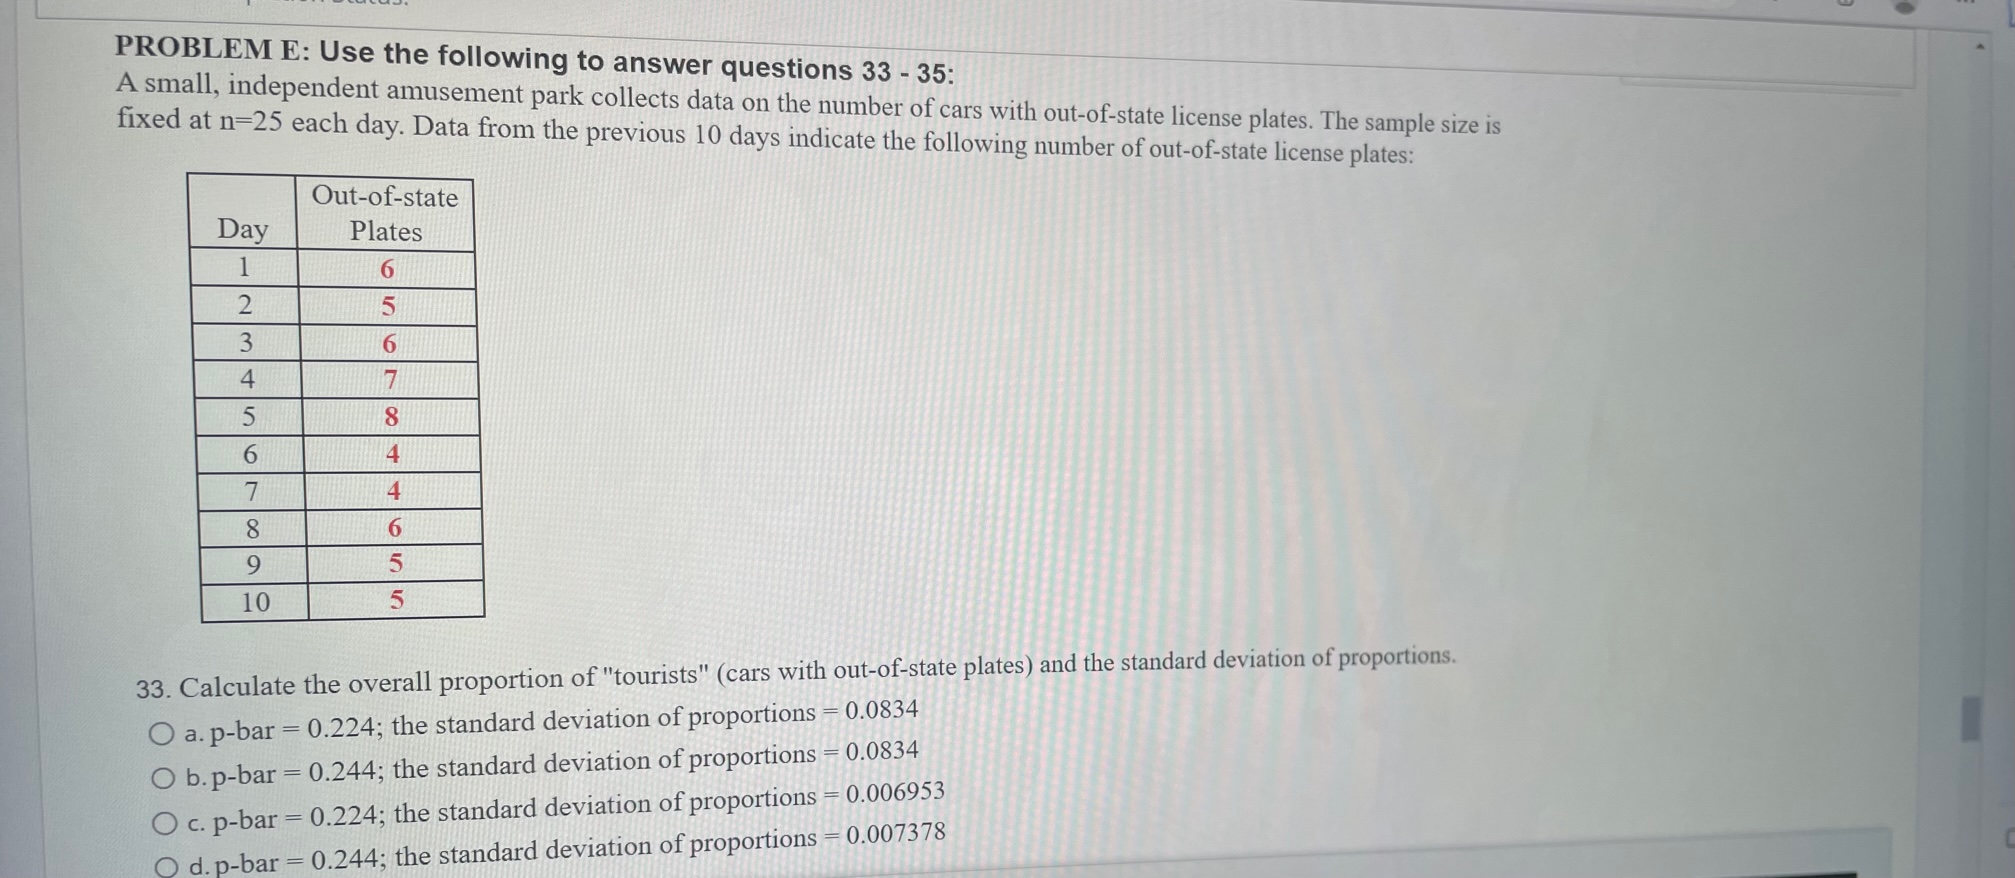
34. Using 3-sigma limits, calculate the LCL and UCL for these data. a. UCL=.4942;LCL=0 b. UCL=.4742;LCL=0 c. UCL=.231;LCL=0.219 d. UCL=.245;LCL=0.203 e. UCL=.266;LCL=0.222 QUESTION 35 35. Is the process under control? a. Days 4 and 5 are above the UCL. The process is not in control. b. Day 10 is below the LCL. The process is not in control. c. All the points are within the control limits. The process is in control. d. Day 5 is above the UCL. The process is not in control. PROBLEM E: Use the following to answer questions 3335 : A small, independent amusement park collects data on the number of cars with out-of-state license plates. The sample size is fixed at n=25 each day. Data from the previous 10 days indicate the following number of out-of-state license plates: 33. Calculate the overall proportion of "tourists" (cars with out-of-state plates) and the standard deviation of proportions. a. p-bar =0.224; the standard deviation of proportions =0.0834 b. p-bar =0.244; the standard deviation of proportions =0.0834 c. p-bar =0.224; the standard deviation of proportions =0.006953 d. p-bar =0.244; the standard deviation of proportions =0.007378
Step by Step Solution
There are 3 Steps involved in it

Get step-by-step solutions from verified subject matter experts