

Question: 347821 ] View Use Excel to create a connected scatter plot of Total Annual Ordering Costs, Total Annual Holding Costs and Total Cost using the
![347821 ] View Use Excel to create a connected scatter plot](https://s3.amazonaws.com/si.experts.images/answers/2024/06/666119b6bd66b_606666119b65011a.jpg)
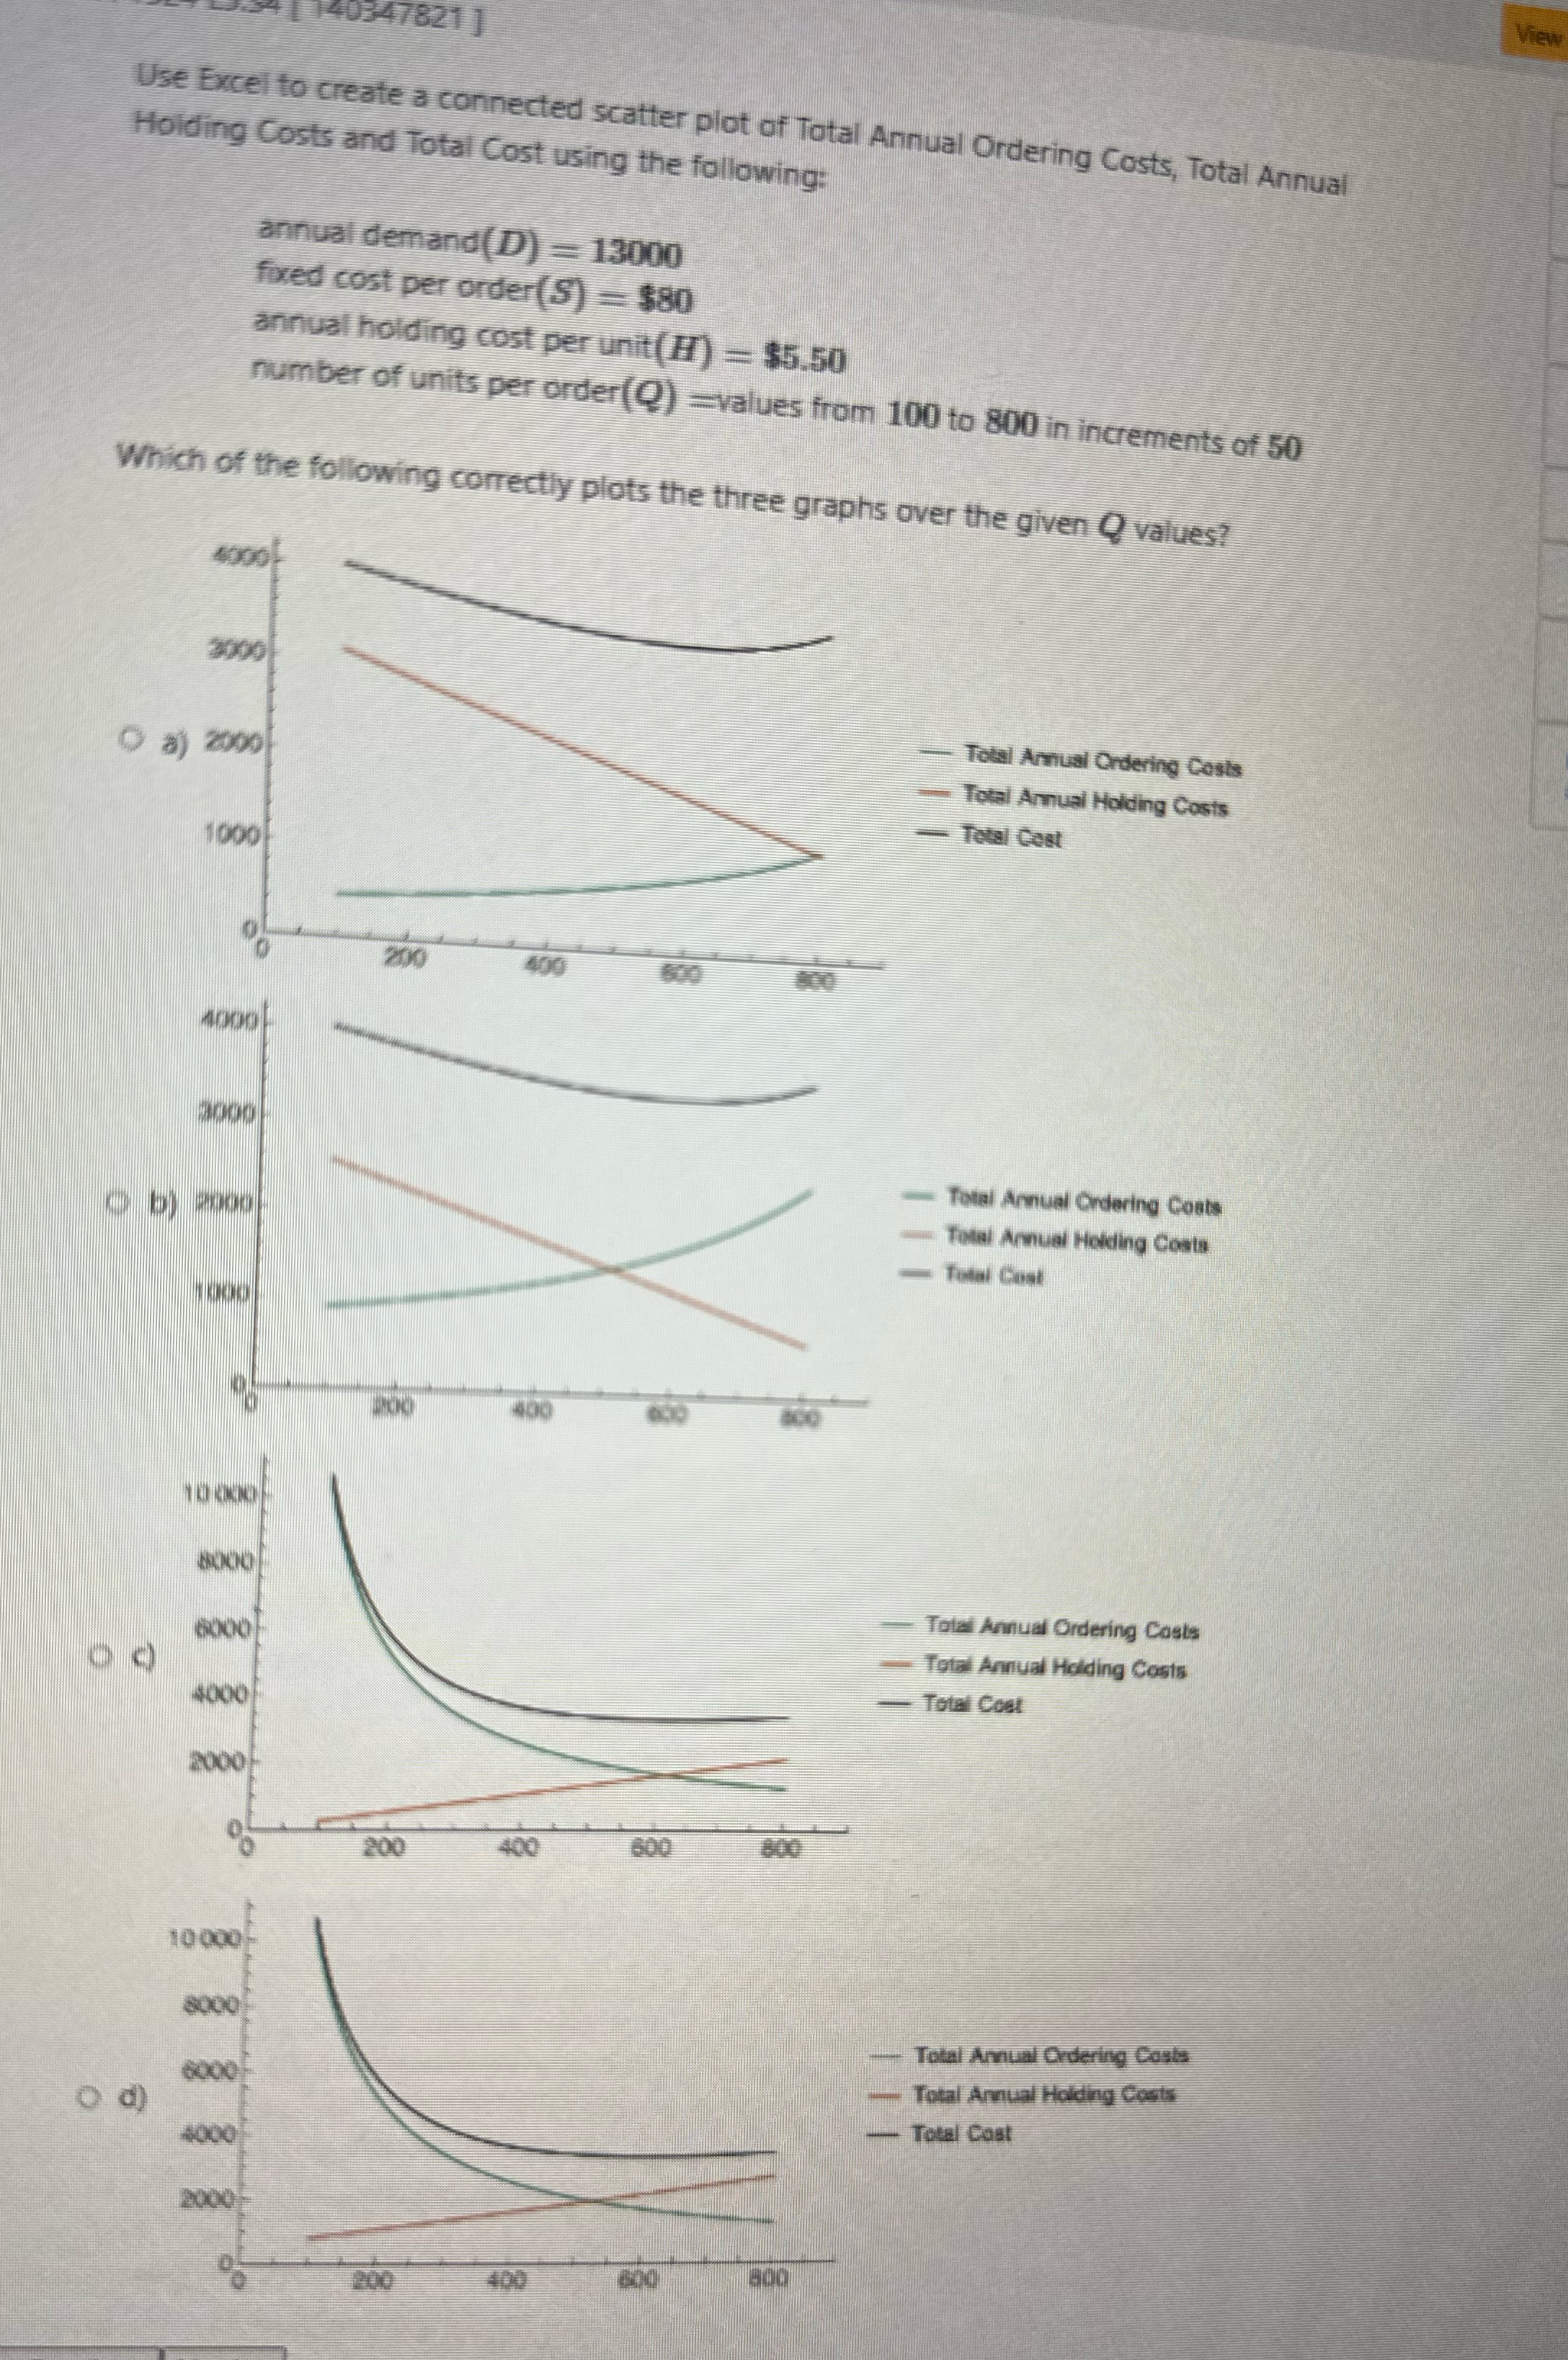
347821 ] View Use Excel to create a connected scatter plot of Total Annual Ordering Costs, Total Annual Holding Costs and Total Cost using the following: annual demand (D) = 13000 fixed cost per order(S) = $80 annual holding cost per unit (H) = $5.50 number of units per order (Q) =values from 100 to 800 in increments of 50 Which of the following correctly plots the three graphs over the given Q values? 4000 3090 Total Annual Ordering Costs Total Annual Holding Costs - Total Cost 100 200 409 600 800 4000 Total Annual Ordering Coats Total Annual Holding Costs Total Cost 400 10 000 6000 Total Annual Ordering Costs 60OO - Total Annual Holding Costs $000 - Total Cost 2000 200 400 800 800 10 000 8000 Total Annual Ordering Casts 6000 Total Annual Holding Costs o d) 8000 Total Cost 2000 200 400 690
Step by Step Solution
There are 3 Steps involved in it

Get step-by-step solutions from verified subject matter experts