

Question: [35 points} Data analysis. We are interested in establishing the relationship between weight and height of men. We set weight as the response variable and
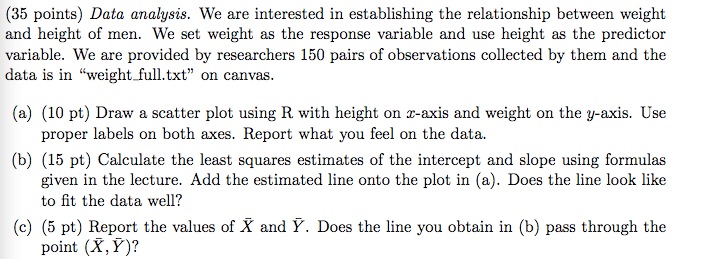
[35 points} Data analysis. We are interested in establishing the relationship between weight and height of men. We set weight as the response variable and use height as the predictor variable. We are provided by researchers 151] pairs of observations collected by them and the data is in \"weightinlltxt\" on canvas. [a] (ill pt} Draw a scatter plot using R with height on m-aiu's and weight on the y-axis. Use proper labels on both axes. Report what you feel on the data. (b) {15 pt} Calculate the least squares estimates of the intercept and slope using formulas given in the lecture. Add the estimated line onto the plot in (a). Does the line look like to t the data well? [c] {5 pt} Report the values of X" and 1". Does the line you obtain in (b) pass through the point (X, 717]
Step by Step Solution
There are 3 Steps involved in it

Get step-by-step solutions from verified subject matter experts