

Question: 35) The cause-and-effect chart is an example of a A) range chart B) Pareto chart C) control chart D) fishbone diagram 36) In a control
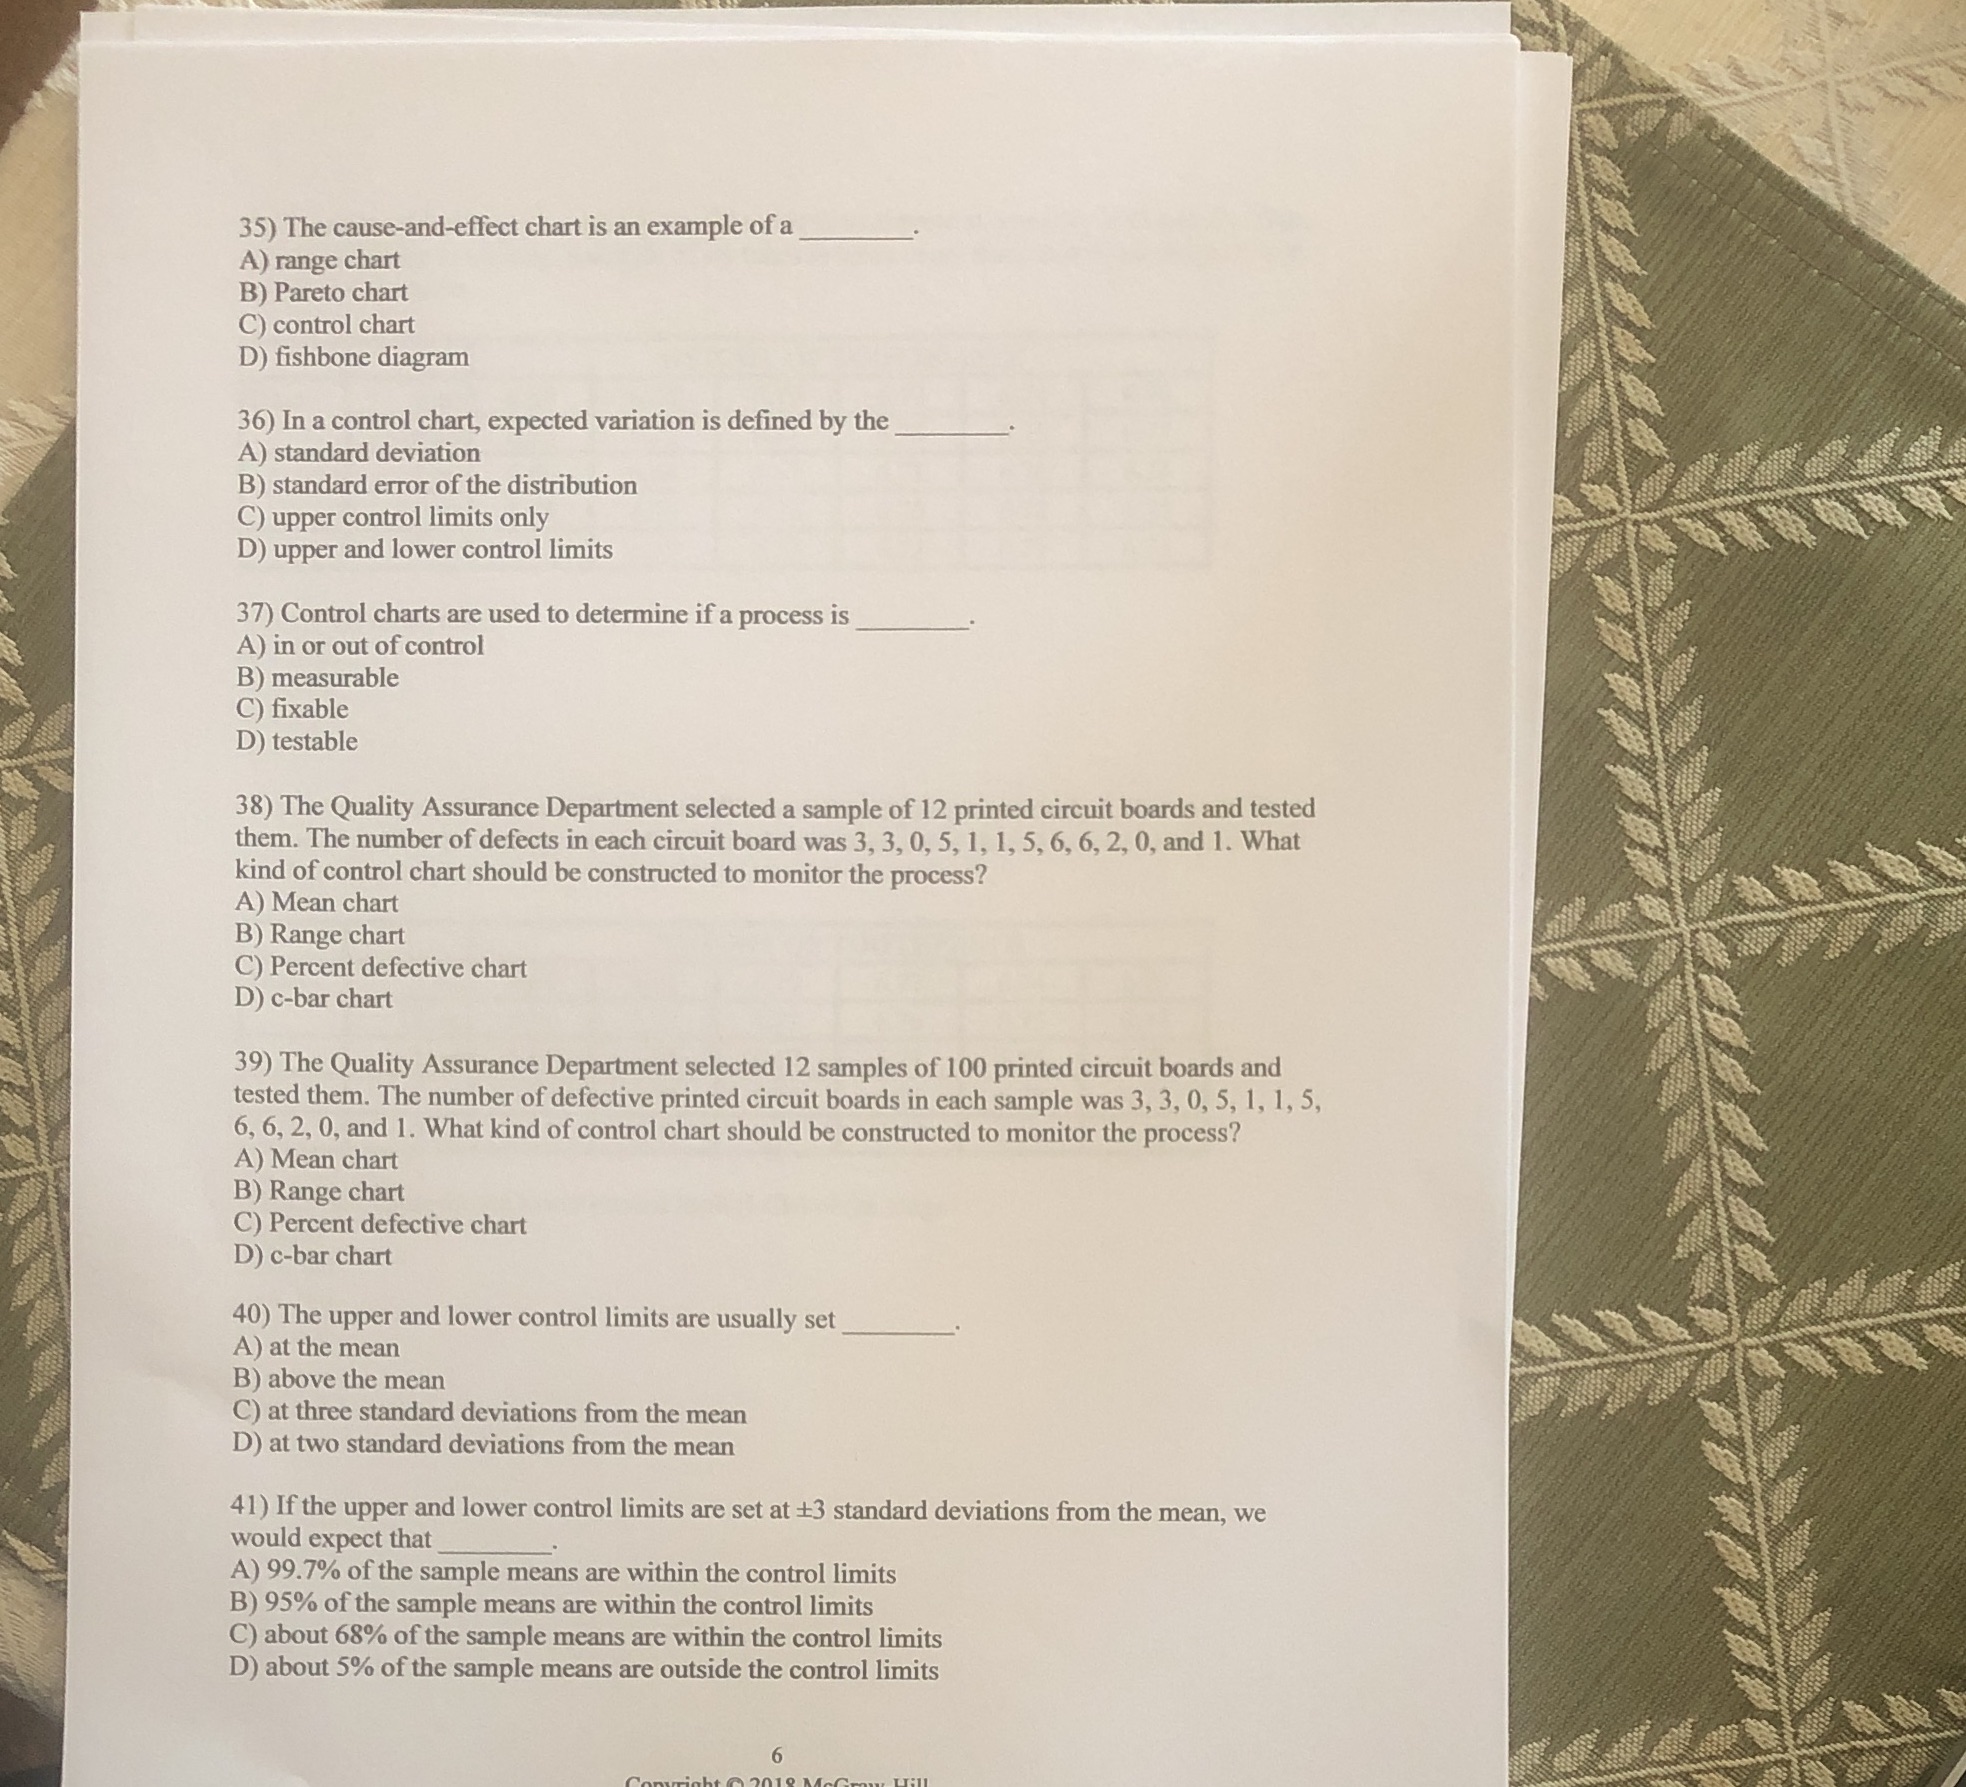
35) The cause-and-effect chart is an example of a A) range chart B) Pareto chart C) control chart D) fishbone diagram 36) In a control chart, expected variation is defined by the A) standard deviation B) standard error of the distribution C) upper control limits only D) upper and lower control limits 37) Control charts are used to determine if a process is A) in or out of control B) measurable C) fixable D) testable 38) The Quality Assurance Department selected a sample of 12 printed circuit boards and tested them. The number of defects in each circuit board was 3, 3, 0, 5, 1, 1, 5, 6, 6, 2, 0, and 1. What kind of control chart should be constructed to monitor the process? A) Mean chart B) Range chart C) Percent defective chart D) c-bar chart 39) The Quality Assurance Department selected 12 samples of 100 printed circuit boards and tested them. The number of defective printed circuit boards in each sample was 3, 3, 0, 5, 1, 1, 5, 6, 6, 2, 0, and 1. What kind of control chart should be constructed to monitor the process? in chart B) Range chart C) Percent defective chart D) c-bar chart 40) The upper and lower control limits are usually set A) at the mean B) above the mean C) at three standard deviations from the mean D) at two standard deviations from the mean 41) If the upper and lower control limits are set at 13 standard deviations from the mean, we would expect that A) 99.7% of the sample means are within the control limits B) 95% of the sample means are within the control limits C) about 68% of the sample means are within the control limits D) about 5% of the sample means are outside the control limits
Step by Step Solution
There are 3 Steps involved in it

Get step-by-step solutions from verified subject matter experts