

Question: 35. This exercise helps to explain the important relationship between demand curves and consumer surplus. Parts (b) (e) of this exercise refer to the following
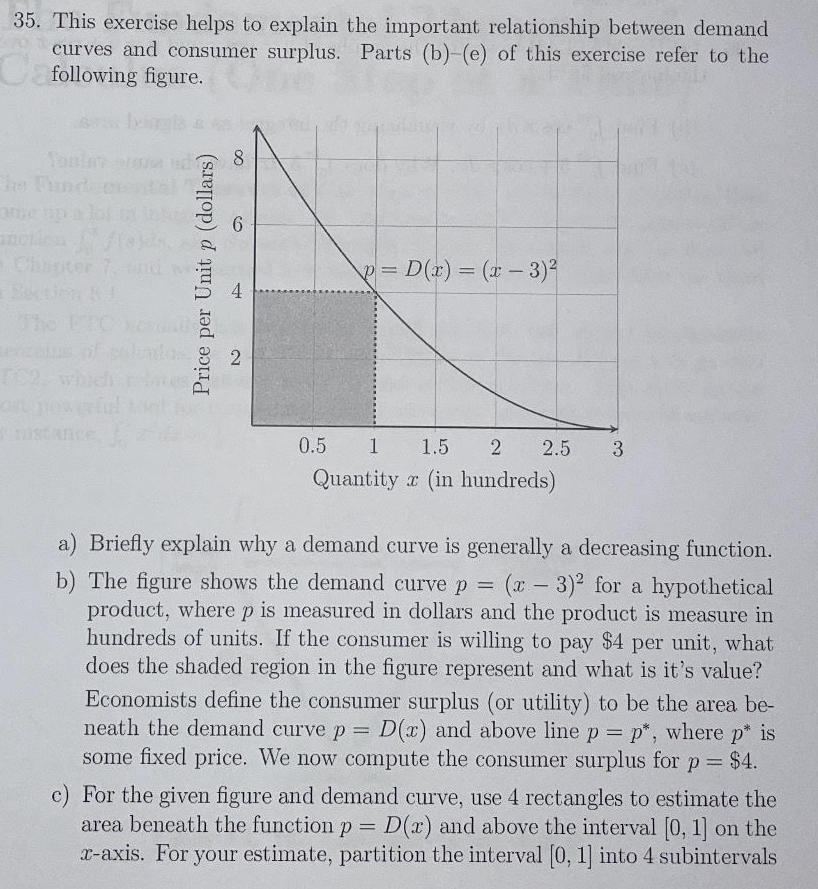
35. This exercise helps to explain the important relationship between demand curves and consumer surplus. Parts (b) (e) of this exercise refer to the following figure. 8 6 p = D(x) = (x -3)2 Price per Unit p (dollars) Section 4 The PUCara 2 02. which thiand Distance 0.5 1 1.5 2 2.5 3 Quantity x (in hundreds) a) Briefly explain why a demand curve is generally a decreasing function. b) The figure shows the demand curve p = (x - 3)' for a hypothetical product, where p is measured in dollars and the product is measure in hundreds of units. If the consumer is willing to pay $4 per unit, what does the shaded region in the figure represent and what is it's value? Economists define the consumer surplus (or utility) to be the area be- neath the demand curve p = D(x) and above line p = p*, where p* is some fixed price. We now compute the consumer surplus for p = $4. c) For the given figure and demand curve, use 4 rectangles to estimate the area beneath the function p = D(x) and above the interval [0, 1] on the x-axis. For your estimate, partition the interval [0, 1] into 4 subintervals
Step by Step Solution
There are 3 Steps involved in it

Get step-by-step solutions from verified subject matter experts