

Question: 37 Done & ohm.lumenlearning.com AA (, Question 3 v 1.67/3pts O 0-1 O Details Score on last try: 1.67 of 3 pts. See Details for
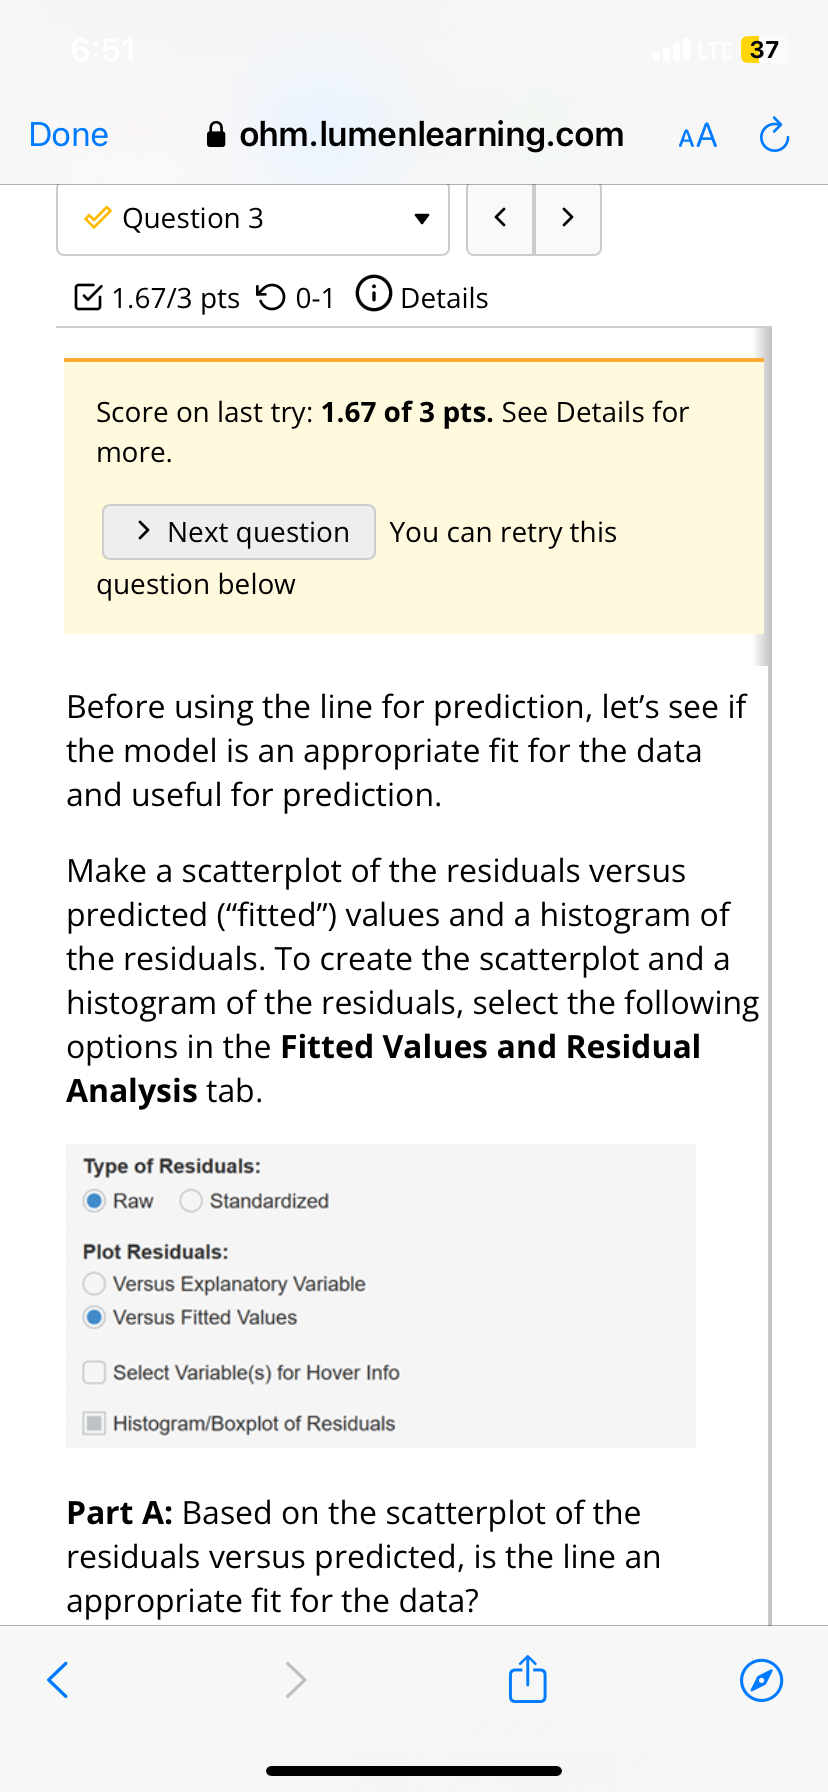
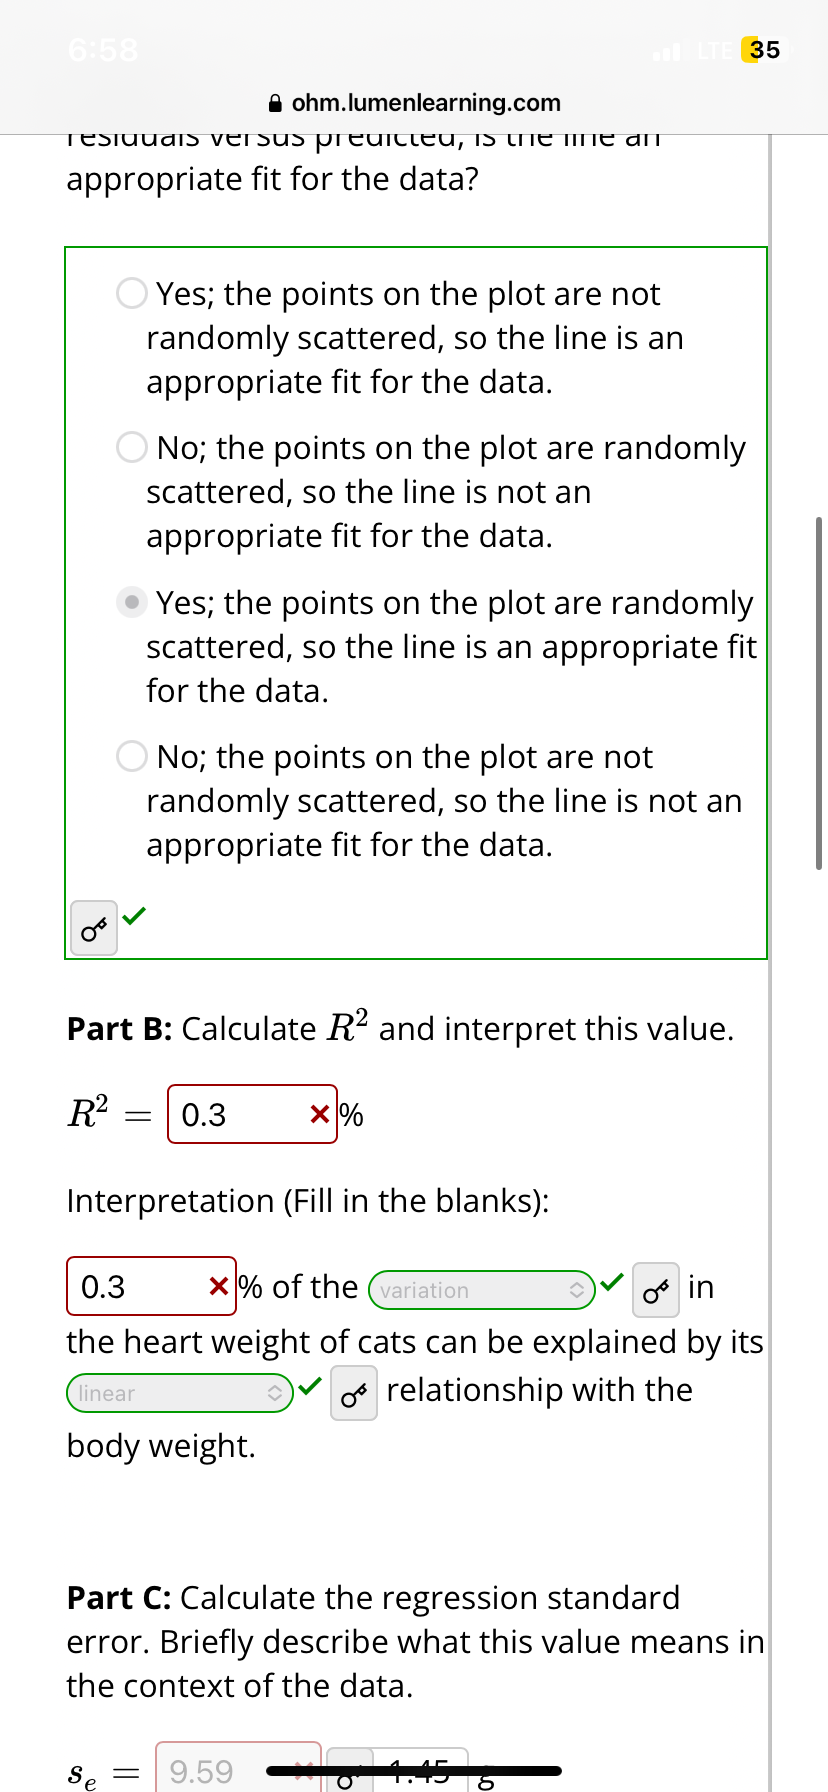
37 Done & ohm.lumenlearning.com AA (, Question 3 v 1.67/3pts O 0-1 O Details Score on last try: 1.67 of 3 pts. See Details for more. > Next question You can retry this question below Before using the line for prediction, let's see if the model is an appropriate fit for the data and useful for prediction. Make a scatterplot of the residuals versus predicted (\"fitted\") values and a histogram of the residuals. To create the scatterplot and a histogram of the residuals, select the following options in the Fitted Values and Residual Analysis tab. Type of Residuals: Raw Standardized Plot Residuals: Versus Explanatory Variable @ Versus Fitted Values Select Variable(s) for Hover Info Histogram/Boxplot of Residuals Part A: Based on the scatterplot of the residuals versus predicted, is the line an appropriate fit for the data?
Step by Step Solution
There are 3 Steps involved in it

Get step-by-step solutions from verified subject matter experts