

Question: 370 LOGLINEAR MODELS FOR CONTINGENCY TABLES Table 9.18 Software Output (Based on SAS) for Fitting a Loglinear Model to Table 9.17 Criteria for Assessing Goodness
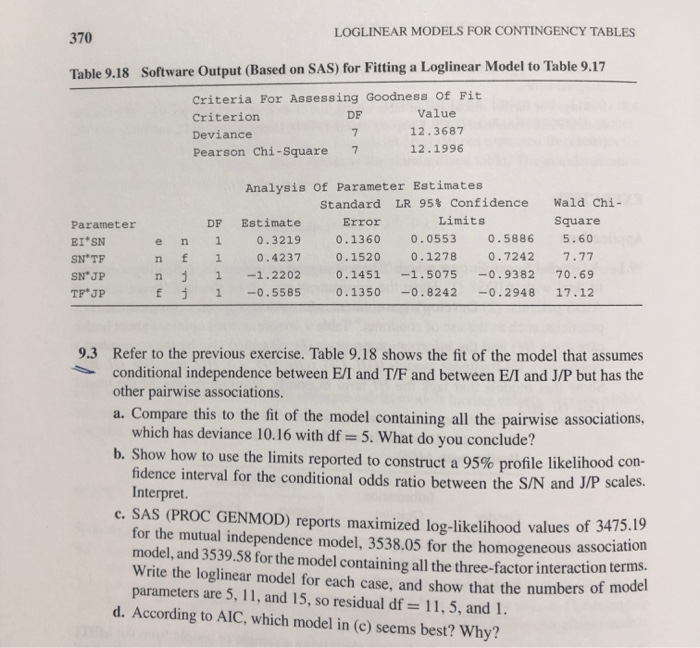
370 LOGLINEAR MODELS FOR CONTINGENCY TABLES Table 9.18 Software Output (Based on SAS) for Fitting a Loglinear Model to Table 9.17 Criteria for Assessing Goodness of Fit Criterion DF Value Deviance 7 12.3687 Pearson Chi-Square 7 12.1996 e Parameter EI SN SNTF SN'JP TFJP n f j j Analysis of Parameter Estimates Standard LR 95% Confidence Estimate Error Limits 0.3219 0.1360 0.0553 0.5886 0.4237 0.1520 0.1278 0.7242 -1.2202 0.1451 -1.5075 -0.9382 -0.5585 0.1350 -0.8242 -0.2948 DF 1 1 1 1 n Wald Chi- Square 5.60 7.77 70.69 17.12 f 9.3 Refer to the previous exercise. Table 9.18 shows the fit of the model that assumes conditional independence between E/I and T/F and between E/I and J/P but has the other pairwise associations. a. Compare this to the fit of the model containing all the pairwise associations, which has deviance 10.16 with df = 5. What do you conclude? b. Show how to use the limits reported to construct a 95% profile likelihood con- fidence interval for the conditional odds ratio between the S/N and J/P scales. Interpret c. SAS (PROC GENMOD) reports maximized log-likelihood values of 3475.19 for the mutual independence model, 3538.05 for the homogeneous association model, and 3539.58 for the model containing all the three-factor interaction terms. Write the loglinear model for each case, and show that the numbers of model parameters are 11, and 15, so residual df = 11, 5, and 1. d. According to AIC, which model in (c) seems best? Why? 370 LOGLINEAR MODELS FOR CONTINGENCY TABLES Table 9.18 Software Output (Based on SAS) for Fitting a Loglinear Model to Table 9.17 Criteria for Assessing Goodness of Fit Criterion DF Value Deviance 7 12.3687 Pearson Chi-Square 7 12.1996 e Parameter EI SN SNTF SN'JP TFJP n f j j Analysis of Parameter Estimates Standard LR 95% Confidence Estimate Error Limits 0.3219 0.1360 0.0553 0.5886 0.4237 0.1520 0.1278 0.7242 -1.2202 0.1451 -1.5075 -0.9382 -0.5585 0.1350 -0.8242 -0.2948 DF 1 1 1 1 n Wald Chi- Square 5.60 7.77 70.69 17.12 f 9.3 Refer to the previous exercise. Table 9.18 shows the fit of the model that assumes conditional independence between E/I and T/F and between E/I and J/P but has the other pairwise associations. a. Compare this to the fit of the model containing all the pairwise associations, which has deviance 10.16 with df = 5. What do you conclude? b. Show how to use the limits reported to construct a 95% profile likelihood con- fidence interval for the conditional odds ratio between the S/N and J/P scales. Interpret c. SAS (PROC GENMOD) reports maximized log-likelihood values of 3475.19 for the mutual independence model, 3538.05 for the homogeneous association model, and 3539.58 for the model containing all the three-factor interaction terms. Write the loglinear model for each case, and show that the numbers of model parameters are 11, and 15, so residual df = 11, 5, and 1. d. According to AIC, which model in (c) seems best? Why
Step by Step Solution
There are 3 Steps involved in it

Get step-by-step solutions from verified subject matter experts