

Question: 3.7.3 The Assignment Your task is to write a model for the subitizing task that does an approximate job of reproducing the data. The following
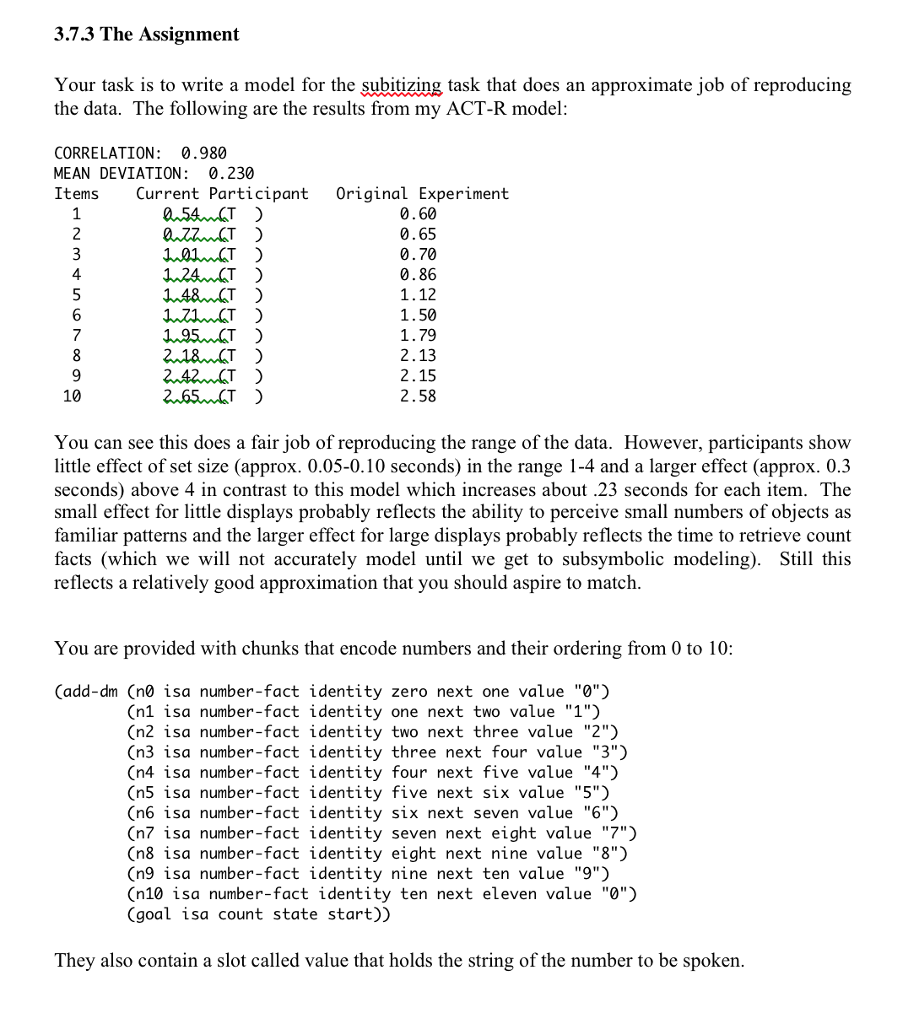
3.7.3 The Assignment Your task is to write a model for the subitizing task that does an approximate job of reproducing the data. The following are the results from my ACT-R model CORRELATION 0.980 MEAN DEVIATION 0.230 Items Current Participant Original Experiment 0.60 0.65 0.70 0.86 1.12 1.50 1.79 2.13 2.15 10 2.58 You can see this does a fair job of reproducing the range of the data. However, participants show little effect of set size (approx. 0.05-0. 10 seconds in the range 1-4 and a larger effect (approx. 0.3 seconds above 4 in contrast to this model which increases about .23 seconds for each item. The small effect for little displays probably reflects the ability to perceive small numbers of objects as familiar patterns and the larger effect for large displays probably reflects the time to retrieve count facts (which we will not accurately model until we get to subsymbolic modeling. Still this reflects a relatively good approximation that you should aspire to match You are provided with chunks that encode numbers and their ordering from 0 to 10: Cadd-dm (no isa number-fact identity zero next one value "0") (n1 isa number-fact identity one next two value "1") (n2 isa number-fact identity two next three value "2") In3 isa number-fact identity three next four value "3") In4 isa number-fact identity four next five value "4") On5 isa number-fact identity five next six value "5") In6 isa number-fact identity six next seven value "6") In7 isa number-fact identity seven next eight value "7"D In8 isa number-fact identity eight next nine value "8") In9 isa number-fact identity nine next ten value "9") (n10 isa number-fact identity ten next eleven value "0") (goal isa count state start They also contain a slot called value that holds the string of the number to be spoken 3.7.3 The Assignment Your task is to write a model for the subitizing task that does an approximate job of reproducing the data. The following are the results from my ACT-R model CORRELATION 0.980 MEAN DEVIATION 0.230 Items Current Participant Original Experiment 0.60 0.65 0.70 0.86 1.12 1.50 1.79 2.13 2.15 10 2.58 You can see this does a fair job of reproducing the range of the data. However, participants show little effect of set size (approx. 0.05-0. 10 seconds in the range 1-4 and a larger effect (approx. 0.3 seconds above 4 in contrast to this model which increases about .23 seconds for each item. The small effect for little displays probably reflects the ability to perceive small numbers of objects as familiar patterns and the larger effect for large displays probably reflects the time to retrieve count facts (which we will not accurately model until we get to subsymbolic modeling. Still this reflects a relatively good approximation that you should aspire to match You are provided with chunks that encode numbers and their ordering from 0 to 10: Cadd-dm (no isa number-fact identity zero next one value "0") (n1 isa number-fact identity one next two value "1") (n2 isa number-fact identity two next three value "2") In3 isa number-fact identity three next four value "3") In4 isa number-fact identity four next five value "4") On5 isa number-fact identity five next six value "5") In6 isa number-fact identity six next seven value "6") In7 isa number-fact identity seven next eight value "7"D In8 isa number-fact identity eight next nine value "8") In9 isa number-fact identity nine next ten value "9") (n10 isa number-fact identity ten next eleven value "0") (goal isa count state start They also contain a slot called value that holds the string of the number to be spoken
Step by Step Solution
There are 3 Steps involved in it

Get step-by-step solutions from verified subject matter experts