

Question: 3.8.1 White Noise Observed through Matched Filters 3.8.7 Example. Consider a matched filter h(t) for a real signal S(t) at time T. The impulse response
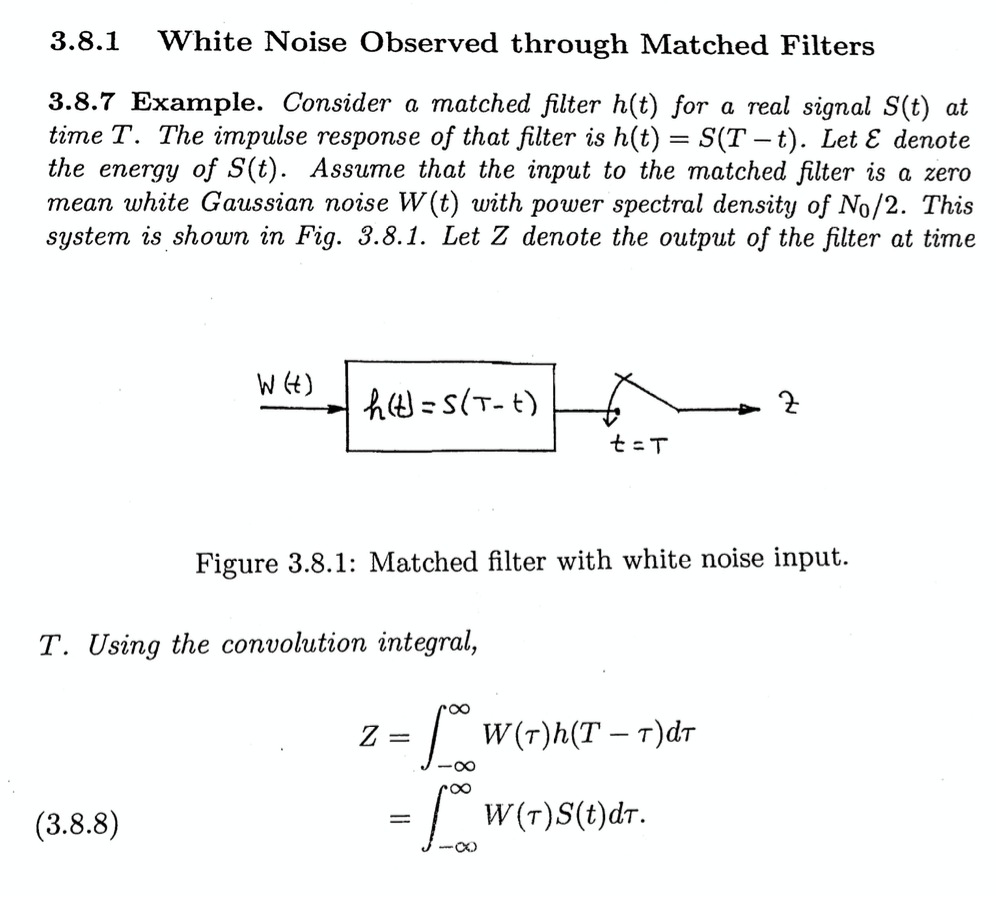
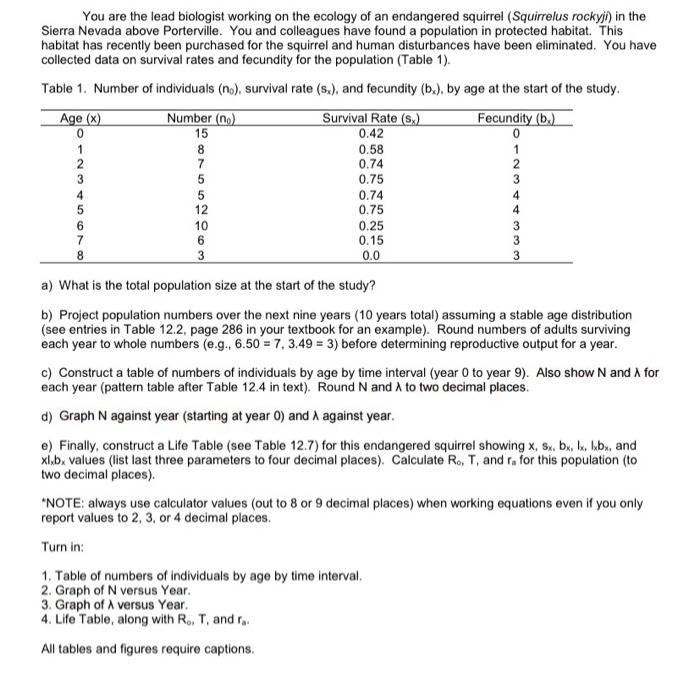
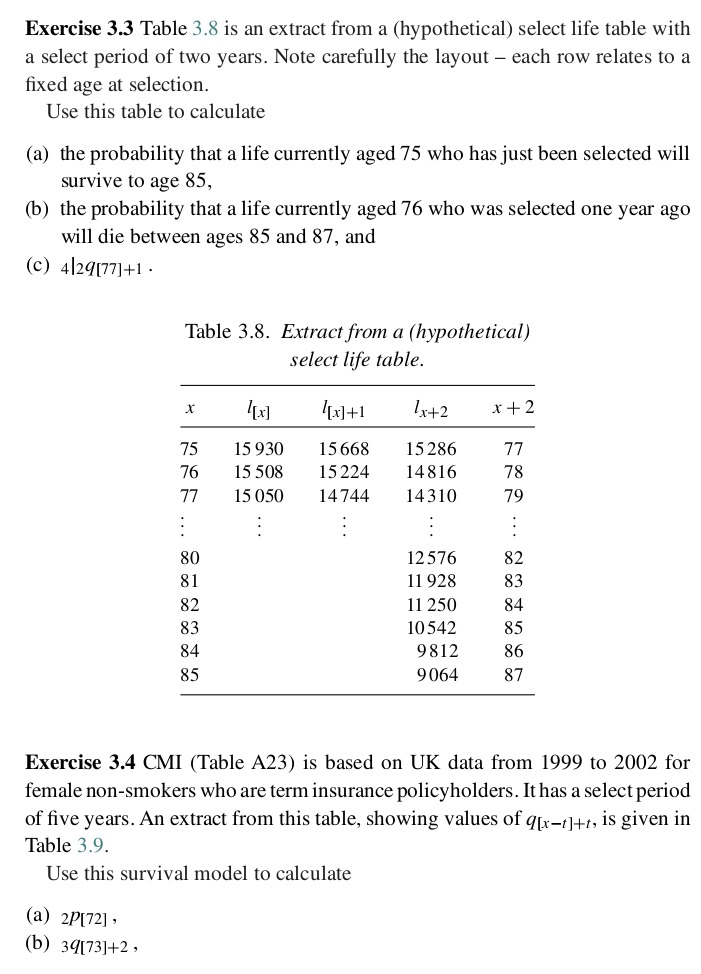
3.8.1 White Noise Observed through Matched Filters 3.8.7 Example. Consider a matched filter h(t) for a real signal S(t) at time T. The impulse response of that filter is h(t) = S(T -t). Let & denote the energy of S(t). Assume that the input to the matched filter is a zero mean white Gaussian noise W(t) with power spectral density of No/2. This system is shown in Fig. 3.8.1. Let Z denote the output of the filter at time WH ) h(t= S(T-t) t= T Figure 3.8.1: Matched filter with white noise input. T. Using the convolution integral, OO Z = W ( T )h ( T - T) dT - 0o roo (3.8.8) = W (T ) S(t) dT. -COYou are the lead biologist working on the ecology of an endangered squirrel (Squirrelus rockyji) in the Sierra Nevada above Porterville. You and colleagues have found a population in protected habitat. This habitat has recently been purchased for the squirrel and human disturbances have been eliminated. You have collected data on survival rates and fecundity for the population (Table 1). Table 1. Number of individuals (no), survival rate (s,), and fecundity (b.), by age at the start of the study. Age (x) Number (no) Survival Rate (S,) Fecundity (b.) 15 0.42 0.58 0.74 WN - 0.75 WARON- 0.74 0.75 0.25 0.15 0.0 a) What is the total population size at the start of the study? b) Project population numbers over the next nine years (10 years total) assuming a stable age distribution (see entries in Table 12.2, page 286 in your textbook for an example). Round numbers of adults surviving each year to whole numbers (e.g., 6.50 = 7, 3.49 = 3) before determining reproductive output for a year. c) Construct a table of numbers of individuals by age by time interval (year 0 to year 9). Also show N and A for each year (pattern table after Table 12.4 in text). Round N and A to two decimal places. d) Graph N against year (starting at year 0) and A against year. e) Finally, construct a Life Table (see Table 12.7) for this endangered squirrel showing x, Sx, bx, I., labx, and xl.b. values (list last three parameters to four decimal places). Calculate Ro, T, and ra for this population (to two decimal places). "NOTE: always use calculator values (out to 8 or 9 decimal places) when working equations even if you only report values to 2, 3, or 4 decimal places. Turn in: 1. Table of numbers of individuals by age by time interval. 2. Graph of N versus Year. 3. Graph of A versus Year. 4. Life Table, along with R., T, and r.. All tables and figures require captions.tively wrote what you meant to write. I. (1 1pts) You are given the following estimated equation: log(price) = 4.83 + 0.000347sqrft + 0.0117barms - 0.056colonial + 0.000068srft . colonial Sid. Errors (0.013) (0.000061) (0.0310) (0.015) (0.000074) n = 88, R-Squared =0.6056 Where the variables are described as follows: price = the house price, in $1000 sqrfi = the size of the house, in squared feet bdrms = the number of bedrooms in the house colonial = 1 if the house has a colonial architectural style, and 0 otherwise. sqrft *colonial = interaction variable a. Provide an appropriate interpretation for the coefficient estimate of the variables 'sqrfi', 'colonial", and 'sqrfi * colonial" repectively. (3pts) b. What is wrong with the statement: "holding everything else constant, the estimated increase in the house price is 0.117% for an additional bedroom"? (1 pt) c. Are the partial slope coefficients individually significant at 5%? (4pts) d. Are the partial slope coefficients jointly significant at 5%? (1pt) e. Calculate the estimated effect of three additional bedrooms of 150 sqrft each, on the price of: i) a colonial house; ii) a non-colonial house (2pts) II. (11 pts) You are given the following economic model: In(ahe) = , + Bedu + Bage + B, female + B.edu. female + B,age. female + Bage* With all the variables described as follows: In(ahe) = natural log of average hourly earnings; age = worker's age; female is a dummy variable equal to 1 if the worker is a female, and 0 if male; age female is an interaction variable equal to age *female; edu - the worker's number of years of education; edu.female is an interaction variable equal to edu *female; age - age*age. From the model above, answer the following questions: a. What is the return to education for a female worker? For a male worker? (2pts) b. What is the effect of getting one year older on the hourly wage of a female worker? On the hourly wage of a male worker? (2pts)Exercise 33 Table 3 .3 is an extract from a (hypothetical) select life table with a select period of two years. Note carefully the layout each row relates to a xed age at selection. Use this table to calculate (a) the probability that a life currently aged 75 who has just been selected will survive to age 35. (b) the probability that a life currently aged 76 who was selected one year ago will die between ages 35 and 3?, and (C) 4|24m1+1 - Table 3.3. Extrectfrom a (hypothetical) select life table. I In] low 31+: I + 2 25 15 930 15663 15 236 T? 26 15503 15224 14316 T3 '1'? 15050 14244 14310 '19 30 12 576 32 31 11923 33 32 11 250 34 33 10 542 35 34 9 312 36 35 9 064 3'? Exercise 3.4 CMI (Table A23) is based on UK data from 1999 to 2002 for female non-smokers who are term insurance policyholders. It has a select period of ve years. An extract from this table, showing values of q[x_;]+;, is given in Table 3.9. Use this survival model to calculate (3) 2pm] 1 03) sq[73]+2
Step by Step Solution
There are 3 Steps involved in it

Get step-by-step solutions from verified subject matter experts