

Question: 39. See Table 2.5 showing financial statement data and stock price data for Mydeco Corp. a. Compute Mydeco's ROE each year from 2009 to
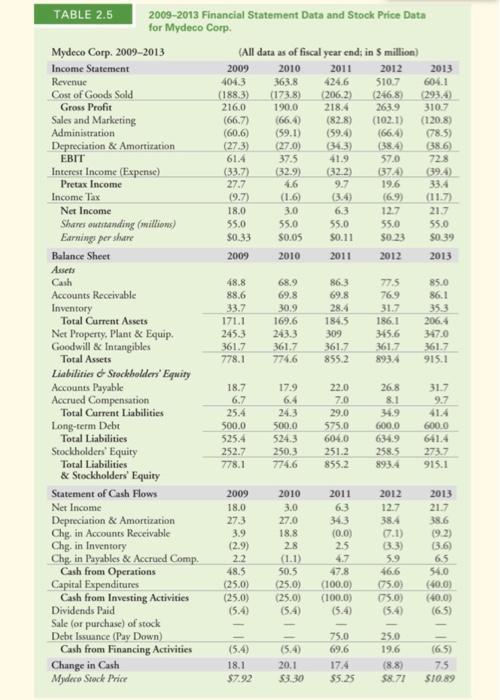
39. See Table 2.5 showing financial statement data and stock price data for Mydeco Corp. a. Compute Mydeco's ROE each year from 2009 to 2013. b. Compute Mydeco's ROA each year from 2009 to 2013. c. Which return is more volatile? Why? 40. See Table 2.5 showing financial statement data and stock price data for Mydeco Corp. Was Mydeco able to improve its ROIC in 2013 relative to what it was in 2009? 2009-2013 Financial Statement Data and Stock Price Data for Mydeco Corp. TABLE 2.5 Mydeco Corp. 2009-2013 (All data as of fiscal year end; in S million) 2010 363.8 Income Statement 2009 2011 2012 2013 Revenue Cost of Goods Sold 404.3 424.6 510.7 604.1 (188.3) 216.0 (173.8) 190.0 (206.2) 218.4 (246.8) 263.9 (293.4) 310.7 Gross Profit Sales and Marketing Administration (66.7) (66.4) (59.1) (27.0) (82.8) (59.4) (34.3) (102.1) (66.4) (38.4) 57.0 (120.8) (78.5) (60.6) Depreciation & Amortization EBIT (27.3) 61.4 38.6) 72.8 37.5 41.9 Interest Income (Expense) Pretax Income (33.7) 27.7 (32.9) 4.6 (1.6) (32.2) 9.7 (37.4) 19.6 (39.4) 33.4 Income Tax (9.7) (3.4) (6.9) (11.7) 21.7 Net Income 18.0 3.0 6.3 12.7 Shares outitanding (millions) Earnings per share 55.0 $0.39 55.0 55.0 55.0 55.0 $0.33 S0.05 $0.11 $0.23 Balance Sheet 2009 2010 2011 2012 2013 Assets Cash Accounts Receivable 48.8 86.3 77.5 769 68.9 85.0 86.1 88.6 69.8 30.9 169.6 243.3 69.8 Inventory Total Current Assets Net Property, Plant & Equip. Goodwill & Intangibles Total Assets 33.7 171.1 245.3 361.7 28.4 31.7 186.1 35.3 206.4 184.5 309 345.6 347.0 361.7 774.6 361.7 855.2 361.7 893.4 361.7 915.1 778.1 Liabilities Stockbolderi' Equity Accounts Payable Accrued Compensation Total Current Liabilities 18.7 17.9 22.0 26.8 31.7 6.7 6.4 24.3 7.0 29.0 8.1 34.9 9.7 25.4 41.4 Long-term Debt Total Liabilities 500.0 500.0 524.3 575.0 600.0 634.9 258.5 600.0 641.4 273.7 525.4 604.0 Stockholders' Equity Total Liabilities 252.7 250.3 774.6 251.2 778.1 855.2 893.4 915.1 & Stockholders' Equity Statement of Cash Flows 2009 2010 2011 2012 2013 Net Income 3.0 6.3 34.3 (0.0) 2.5 12.7 38.4 7.1) 3.3) 5.9 18.0 21.7 Depreciation & Amortization Chg in Accounts Receivable Chg. in Inventory Chg, in Payables & Accrued Comp. Cash from Operations Capital Expenditures Cash from Investing Activities Dividends Paid 27.3 3.9 (2.9) 2.2 27.0 38.6 18.8 (9.2) (3.6) 2.8 6.5 54.0 (1.1) 4.7 48.5 50.5 47.8 46.6 (75.0) 75.0) (25.0) (25.0) (25.0) (5.4) (100.0) (40.0) (25.0) (5.4) (100.0) (40.0) (5.4) (5.4) (6.5) Sale (or purchase) of stock Debt Issuance (Pay Down) Cash from Financing Activities Change in Cash Mydeco Stock Price 75.0 25.0 19.6 (5.4) (5.4) 69.6 (6.5) 18.1 20.1 17.4 (8.8) $8.71 7.5 $7.92 $3.30 $5.25 S10.89
Step by Step Solution
3.49 Rating (152 Votes )
There are 3 Steps involved in it
Question 39 Part a Year 2009 2010 2011 2012 2013 Net Income 18 3 63 127 217 Shareholders Equity 2527 ... View full answer

Get step-by-step solutions from verified subject matter experts