

Question: 3b) Interval. FrequencyOne to under three. 2Three to under five. 4Five to under seven. 8Seven to under nine. 5Nine to under 11. 1C) interval. Frequency20
3b) Interval. FrequencyOne to under three. 2Three to under five. 4Five to under seven. 8Seven to under nine. 5Nine to under 11. 1C) interval. Frequency20 to under 25. 125 to under 30. 630 to under 35. 1035 to under 40. 240 to under 45 1D) X 10 20 30 40 50 60F 3 9 14. 10. 6. 4
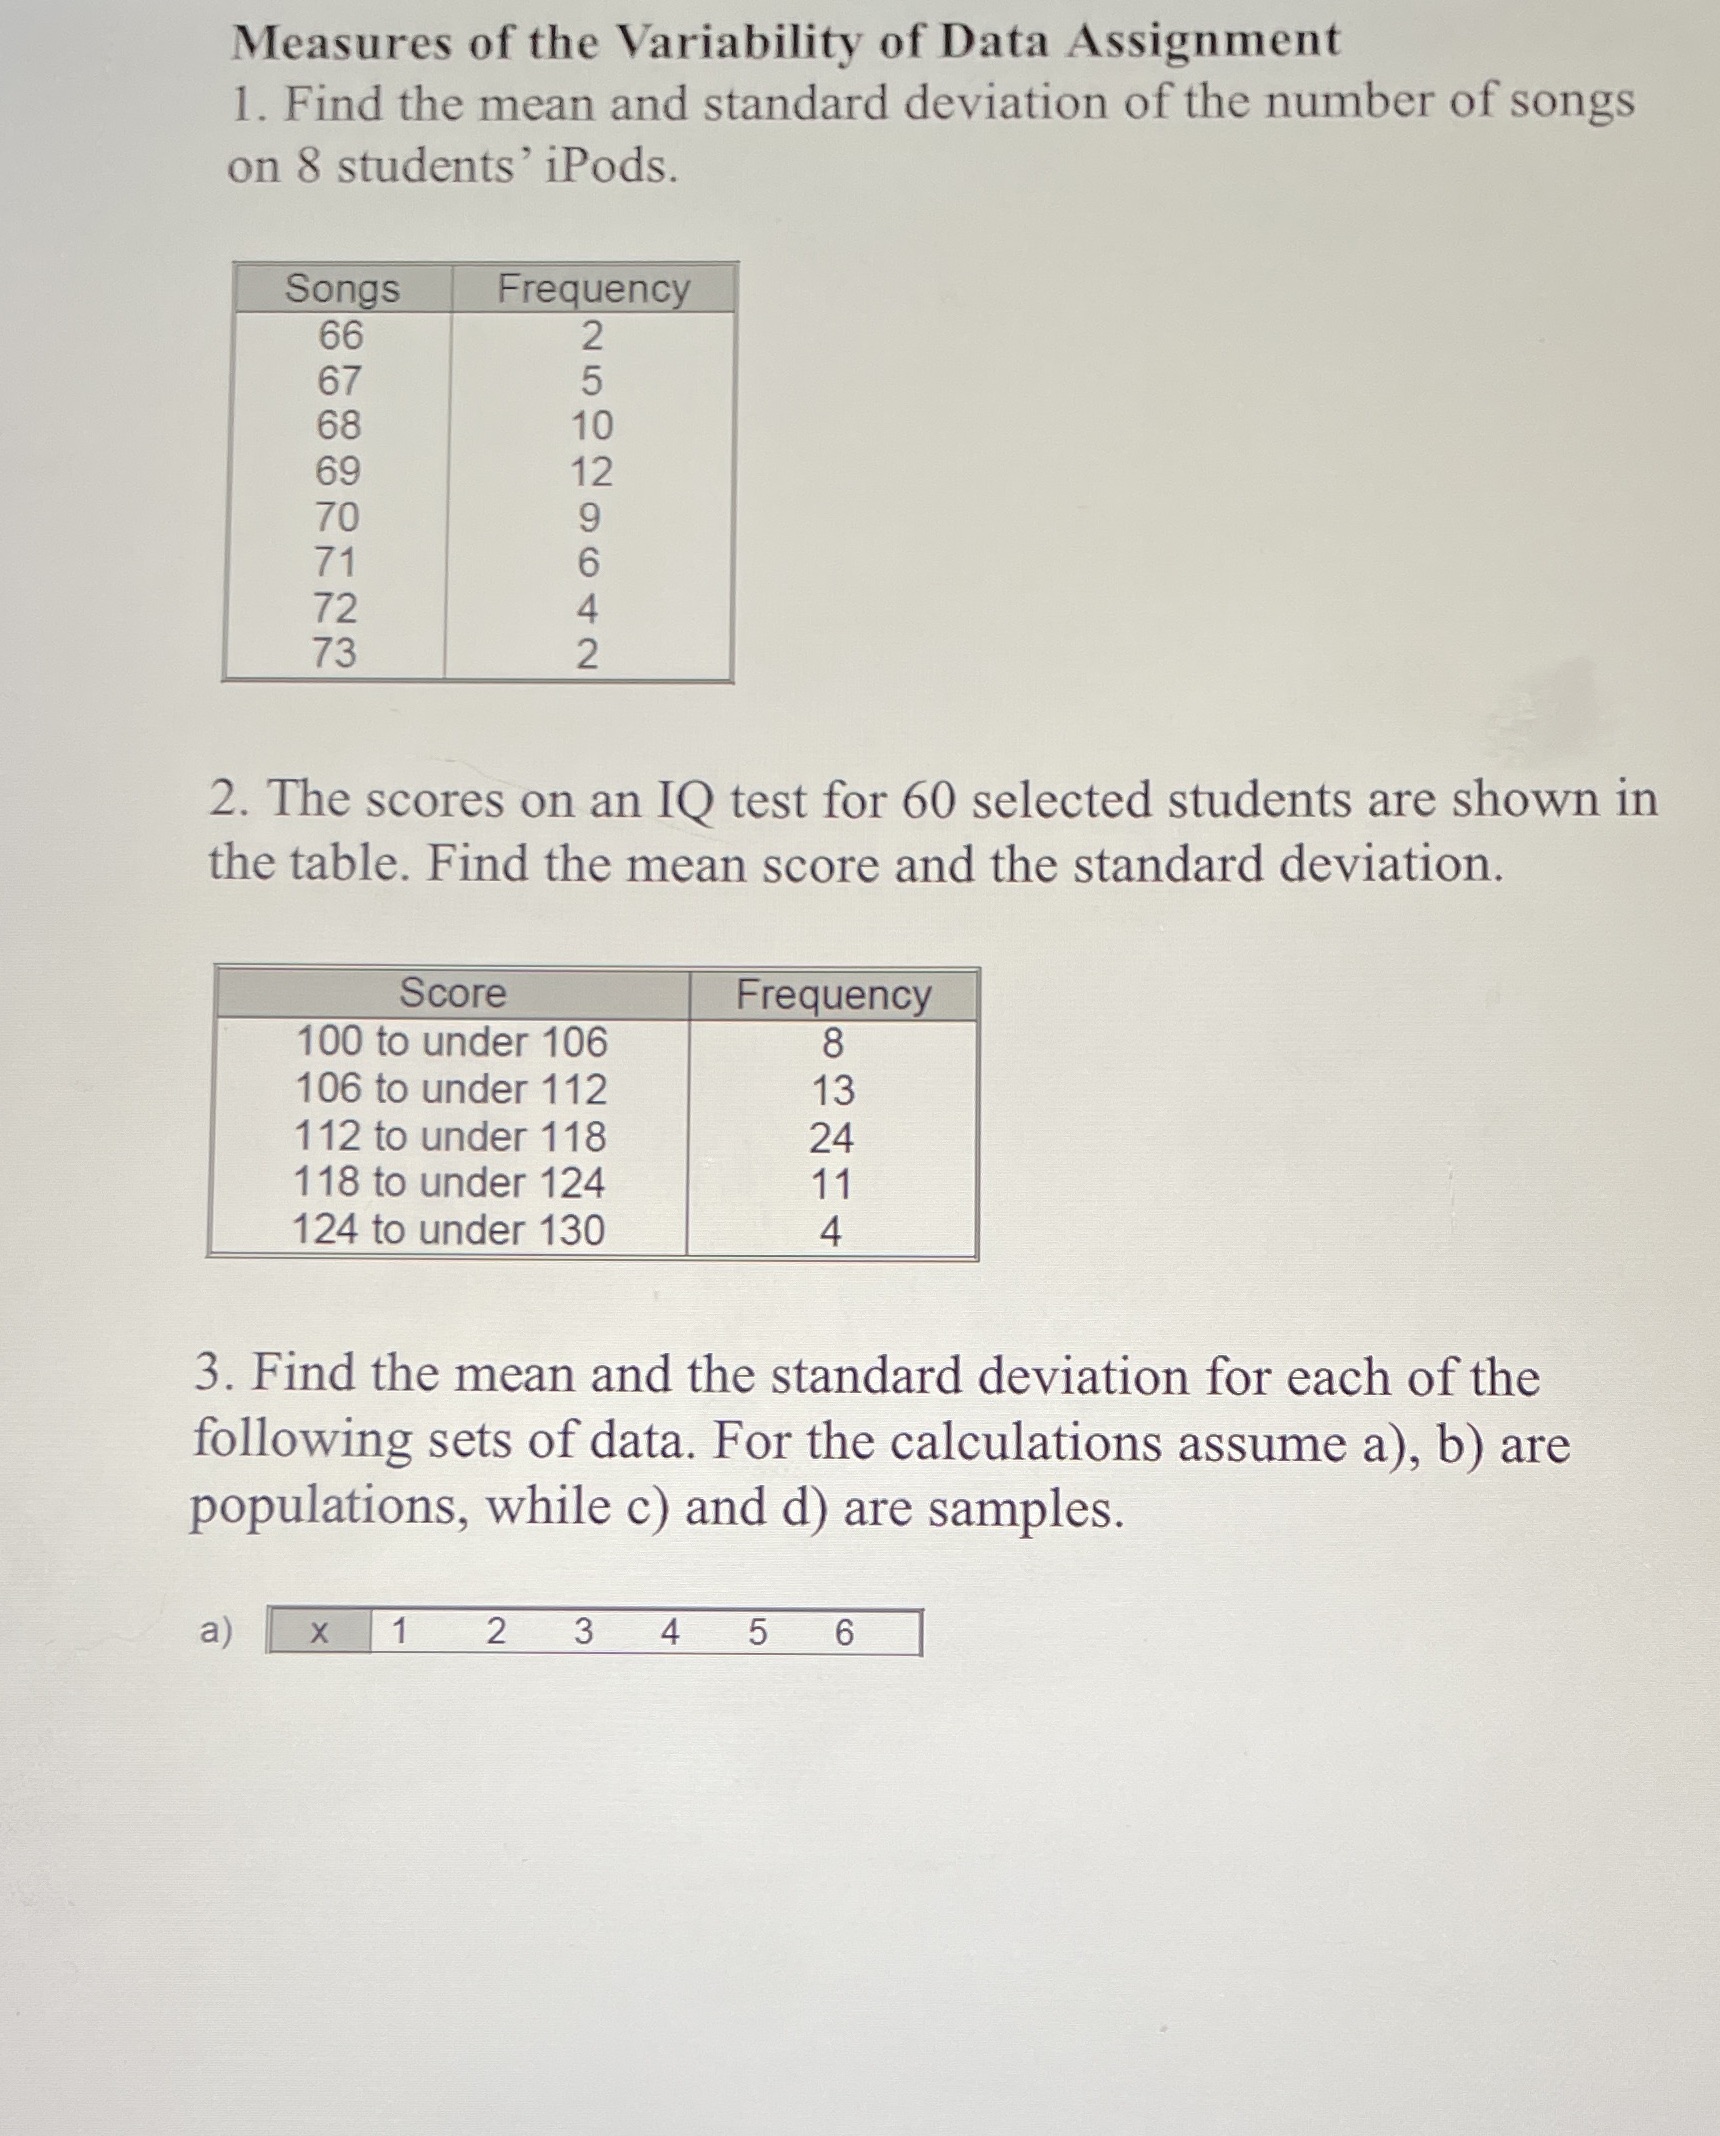
Measures of the Variability of Data Assignment 1. Find the mean and standard deviation of the number of songs on 8 students' iPods. Songs Frequency 66 67 68 10 69 12 70 9 71 6 72 4 73 N 2. The scores on an IQ test for 60 selected students are shown in the table. Find the mean score and the standard deviation. Score Frequency 100 to under 106 8 106 to under 112 13 112 to under 118 24 118 to under 124 11 124 to under 130 4 3. Find the mean and the standard deviation for each of the following sets of data. For the calculations assume a), b) are populations, while c) and d) are samples. a ) x 1 2 3 4 5 6
Step by Step Solution
There are 3 Steps involved in it

Get step-by-step solutions from verified subject matter experts