

Question: 3c) For the following processes,draw the priority scheduling gantt chart and estimate (2) average waiting time: Process Burst Time Priority P 10 3 P2 1
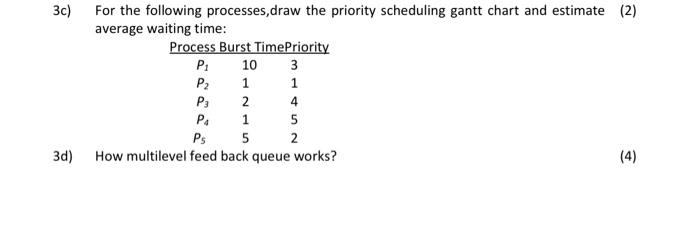
3c) For the following processes,draw the priority scheduling gantt chart and estimate (2) average waiting time: Process Burst Time Priority P 10 3 P2 1 1 P: 2 Pa 1 5 PS 5 2. 3d) How multilevel feed back queue works? (4) 4
Step by Step Solution
There are 3 Steps involved in it
1 Expert Approved Answer
Step: 1 Unlock

Question Has Been Solved by an Expert!
Get step-by-step solutions from verified subject matter experts
Step: 2 Unlock
Step: 3 Unlock