

Question: 3Categorical Data Analysis a.) In our sample, race is represented by three categories (1=white, 2=black, 3=other). The US Census Bureau reports1 that in 2019, 76.3%
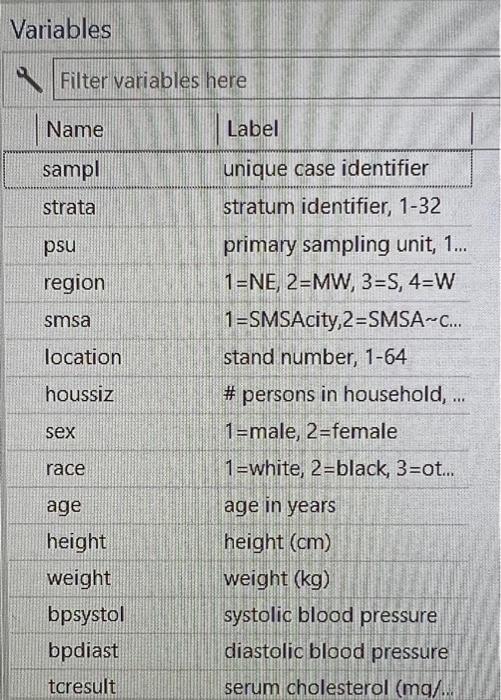
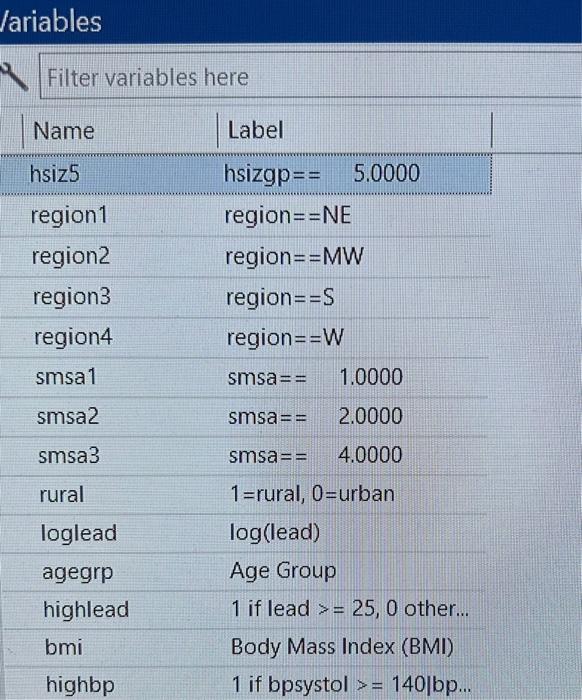
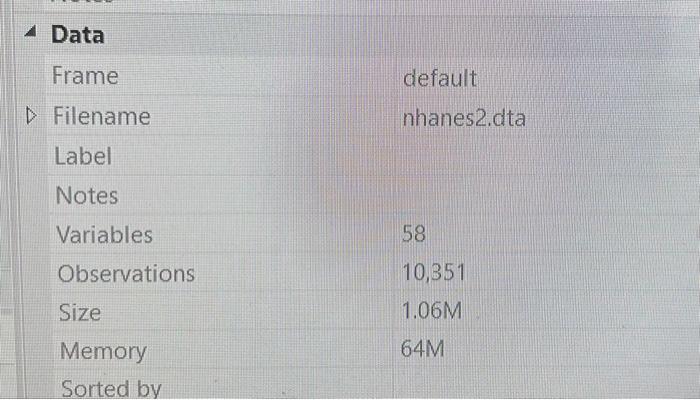
Variables Filter variables here \begin{tabular}{|l|l|} \hline | Name & Label \\ \hline sampl & unique case identifier \\ \hline strata & stratum identifier, 1-32 \\ psu & primary sampling unit, 1... \\ region & 1=NE,2=MW,3=S,4=W \\ \hline smsa & 1= SMSAcity, 2= SMSA C... \\ \hline location & stand number, 1-64 \\ houssiz & \# persons in household, ... \\ sex & 1= male, 2= female \\ race & 1= white, 2= black, 3=ot... \\ age & age in years \\ height & height (cm) \\ weight & weight (kg) \\ bpsystol & systolic blood pressure \\ bpdiast & diastolic blood pressure \\ tcresult & serum cholesterol (ma).. \end{tabular} Variables Variables Filter variables here lariables Filter variables here \begin{tabular}{|l|l|} \hline Name & Label \\ \hline hsiz5 & hsizgp ==5.0000 \\ \hline region1 & region == NE \\ region2 & region ==MW \\ region3 & region ==S \\ \hline region4 & region ==W \\ \hline smsa1 & smsa ==1.0000 \\ smsa2 & smsa ==2.0000 \\ smsa3 & smsa ==4.0000 \\ rural & 1= rural, 0= urban \\ loglead & log(lead) \\ agegrp & Age Group \\ highlead & 1 if lead >=25,0 other... \\ bmi & Body Mass Index (BMI) \\ highbp & 1 if bpsystol >= 140|bp... \end{tabular} Data Frame default Filename nhanes2.dta Label Notes Variables 58 Observations 10,351 Size 1.06M Memory 64M Sorted by Variables Filter variables here \begin{tabular}{|l|l|} \hline | Name & Label \\ \hline sampl & unique case identifier \\ \hline strata & stratum identifier, 1-32 \\ psu & primary sampling unit, 1... \\ region & 1=NE,2=MW,3=S,4=W \\ \hline smsa & 1= SMSAcity, 2= SMSA C... \\ \hline location & stand number, 1-64 \\ houssiz & \# persons in household, ... \\ sex & 1= male, 2= female \\ race & 1= white, 2= black, 3=ot... \\ age & age in years \\ height & height (cm) \\ weight & weight (kg) \\ bpsystol & systolic blood pressure \\ bpdiast & diastolic blood pressure \\ tcresult & serum cholesterol (ma).. \end{tabular} Variables Variables Filter variables here lariables Filter variables here \begin{tabular}{|l|l|} \hline Name & Label \\ \hline hsiz5 & hsizgp ==5.0000 \\ \hline region1 & region == NE \\ region2 & region ==MW \\ region3 & region ==S \\ \hline region4 & region ==W \\ \hline smsa1 & smsa ==1.0000 \\ smsa2 & smsa ==2.0000 \\ smsa3 & smsa ==4.0000 \\ rural & 1= rural, 0= urban \\ loglead & log(lead) \\ agegrp & Age Group \\ highlead & 1 if lead >=25,0 other... \\ bmi & Body Mass Index (BMI) \\ highbp & 1 if bpsystol >= 140|bp... \end{tabular} Data Frame default Filename nhanes2.dta Label Notes Variables 58 Observations 10,351 Size 1.06M Memory 64M Sorted by
Step by Step Solution
There are 3 Steps involved in it

Get step-by-step solutions from verified subject matter experts