

Question: 3.D Summary statistics: Column n Mean Variance Std. dev. Std. g. Median Range Min Max 01 03 Weight 8341 2813251364528? 36.939528 4.0546399 420 191 282
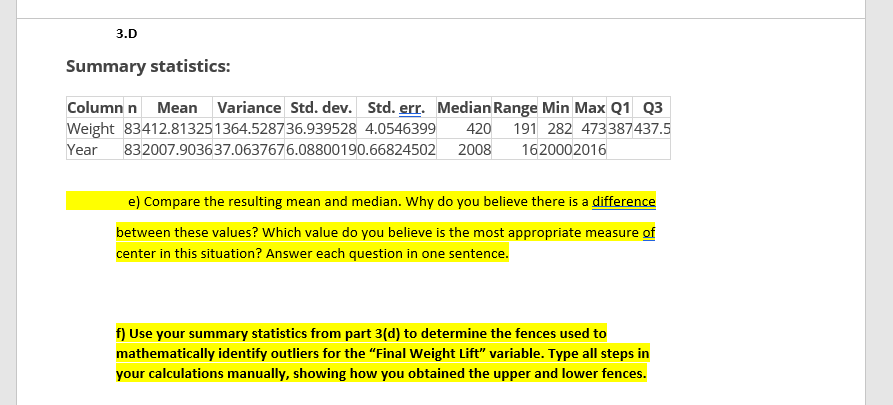
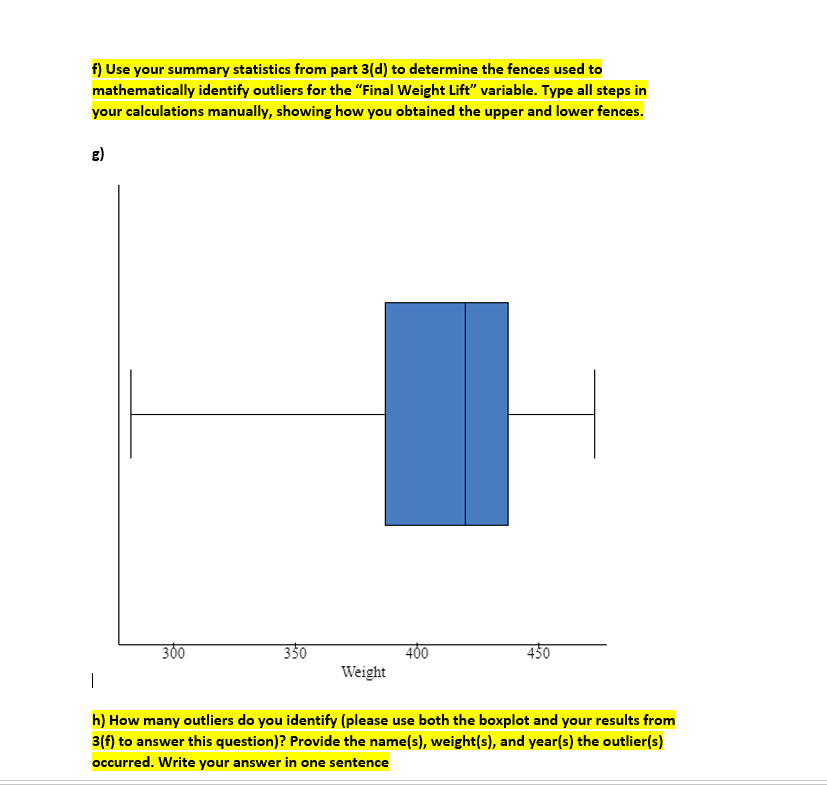
3.D Summary statistics: Column n Mean Variance Std. dev. Std. g. Median Range Min Max 01 03 Weight 8341 2813251364528? 36.939528 4.0546399 420 191 282 473 381'43'1'5 Year 83 20019036 3106376? 6. 088001 9066824502 2008 162000201 6 e} Compare the resulting mean and median. IWhy do you believe there is a difference between these values? Which value do you believe is the most appropriate measure o_I center in this situation? Answer each question in one sentence. I] Use your summary statistics from part 3{d} to determine the fences used to mathematically identify outliers for tire I"Final Weight Lift\" variable. Type all steps in your calculations manually, showing how you obtained the upper and lower fences. f) Use your summary statistics from part 3(d) to determine the fences used to mathematically identify outliers for the "Final Weight Lift" variable. Type all steps in your calculations manually, showing how you obtained the upper and lower fences. 300 350 400 450 Weight - h) How many outliers do you identify (please use both the boxplot and your results from 3(f) to answer this question)? Provide the name(s), weight(s), and year(s) the outlier(s) occurred. Write your answer in one sentence
Step by Step Solution
There are 3 Steps involved in it

Get step-by-step solutions from verified subject matter experts