

Question: Look at the plot below. Assuming all trials are from the same gel filtration column fraction, Explain what is likely going on in each
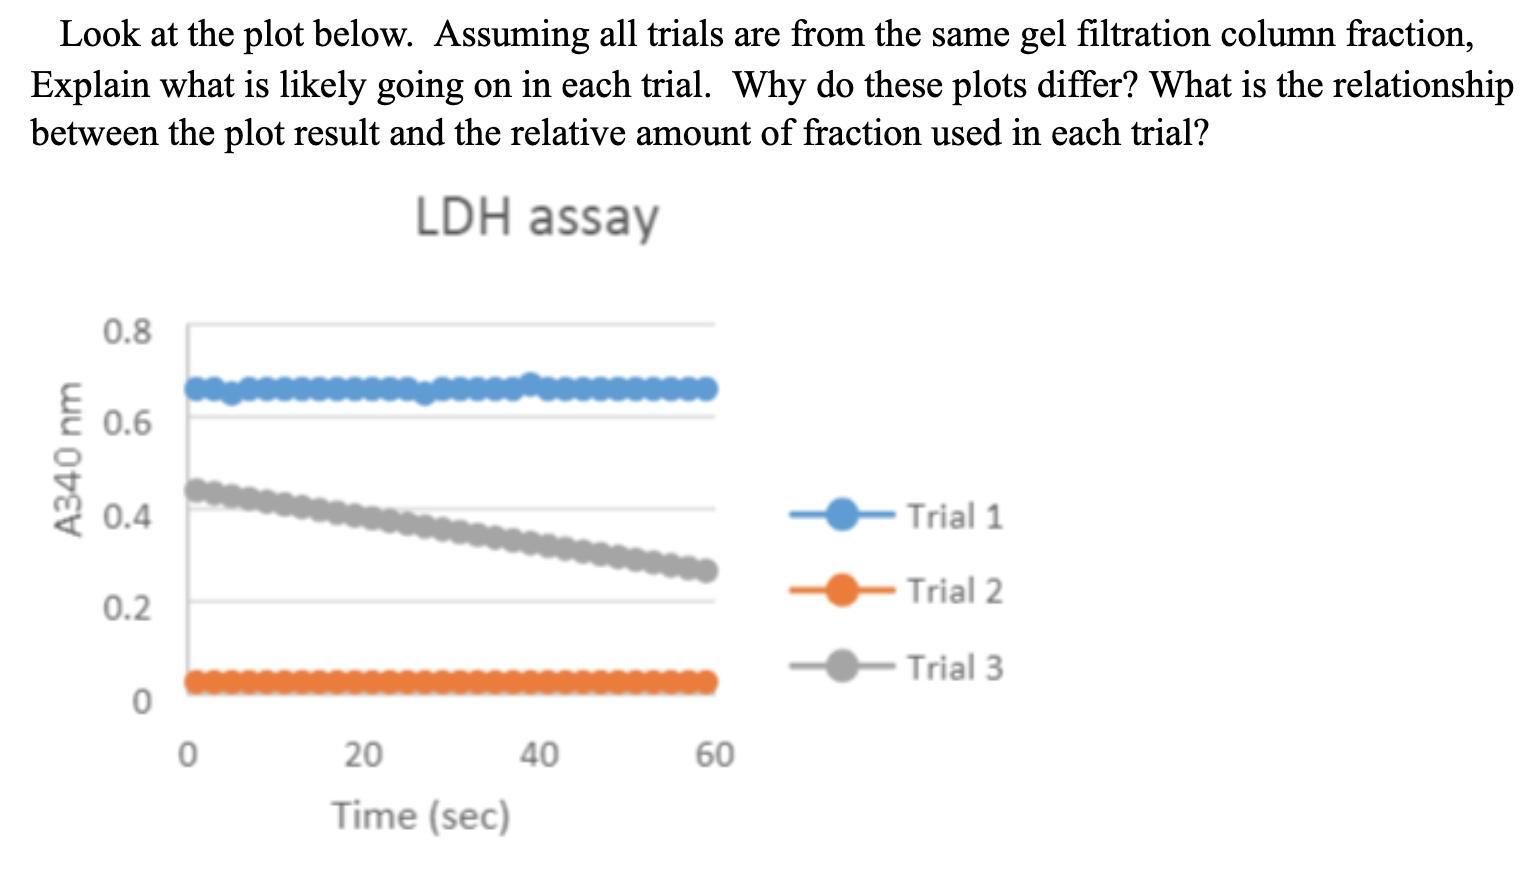
Look at the plot below. Assuming all trials are from the same gel filtration column fraction, Explain what is likely going on in each trial. Why do these plots differ? What is the relationship between the plot result and the relative amount of fraction used in each trial? LDH assay 0.8 0.6 0.4 Trial 1 Trial 2 0.2 Trial 3 20 40 60 Time (sec) A340 nm
Step by Step Solution
★★★★★
3.38 Rating (154 Votes )
There are 3 Steps involved in it
1 Expert Approved Answer
Step: 1 Unlock

The following is the most likely to take the test I In Trial 1 and the optical density A340 nm the m... View full answer
Question Has Been Solved by an Expert!
Get step-by-step solutions from verified subject matter experts
Step: 2 Unlock
Step: 3 Unlock