

Question: (3p.) Use the figure from question #2 to interpret the seasonal regularity to the time series data (e-commerce retail sales). For instance, in which quarters
(3p.)
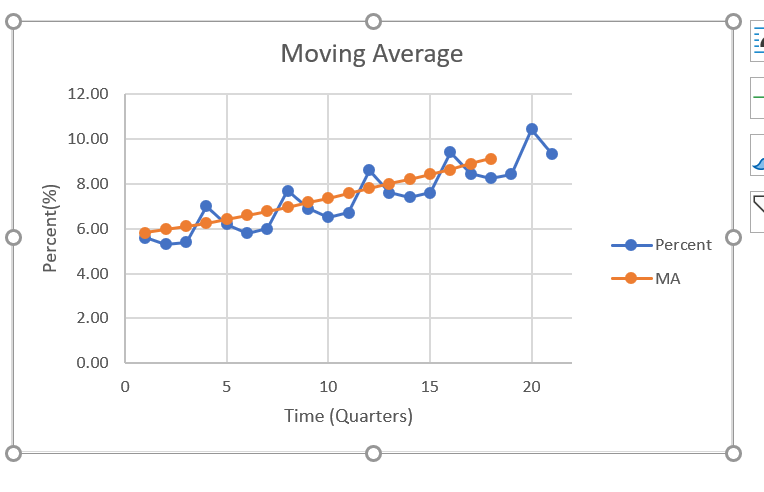
Use the figure from question #2 to interpret the seasonal regularity to the time series data (e-commerce retail sales). For instance, in which quarters do you observe percent sales are the lowest or the highest, or in which quarters do you observe a rise or a decline? Compare and contrast the component that you observe in the time series and the moving averages.
Moving Average 12.00 10.00 8.00 Percent(%) 6.00 Percent 4.00 MA 2.00 0.00 0 5 20 10 15 Time (Quarters) Moving Average 12.00 10.00 8.00 Percent(%) 6.00 Percent 4.00 MA 2.00 0.00 0 5 20 10 15 Time (Quarters)
Step by Step Solution
There are 3 Steps involved in it
1 Expert Approved Answer
Step: 1 Unlock

Question Has Been Solved by an Expert!
Get step-by-step solutions from verified subject matter experts
Step: 2 Unlock
Step: 3 Unlock