

Question: 3.Plot the estimates as a function of m - include the analytical mean and variance in the plots for comparison? O X Probability and
3.Plot the estimates as a function of m - include the analytical mean and variance in the plots for comparison?

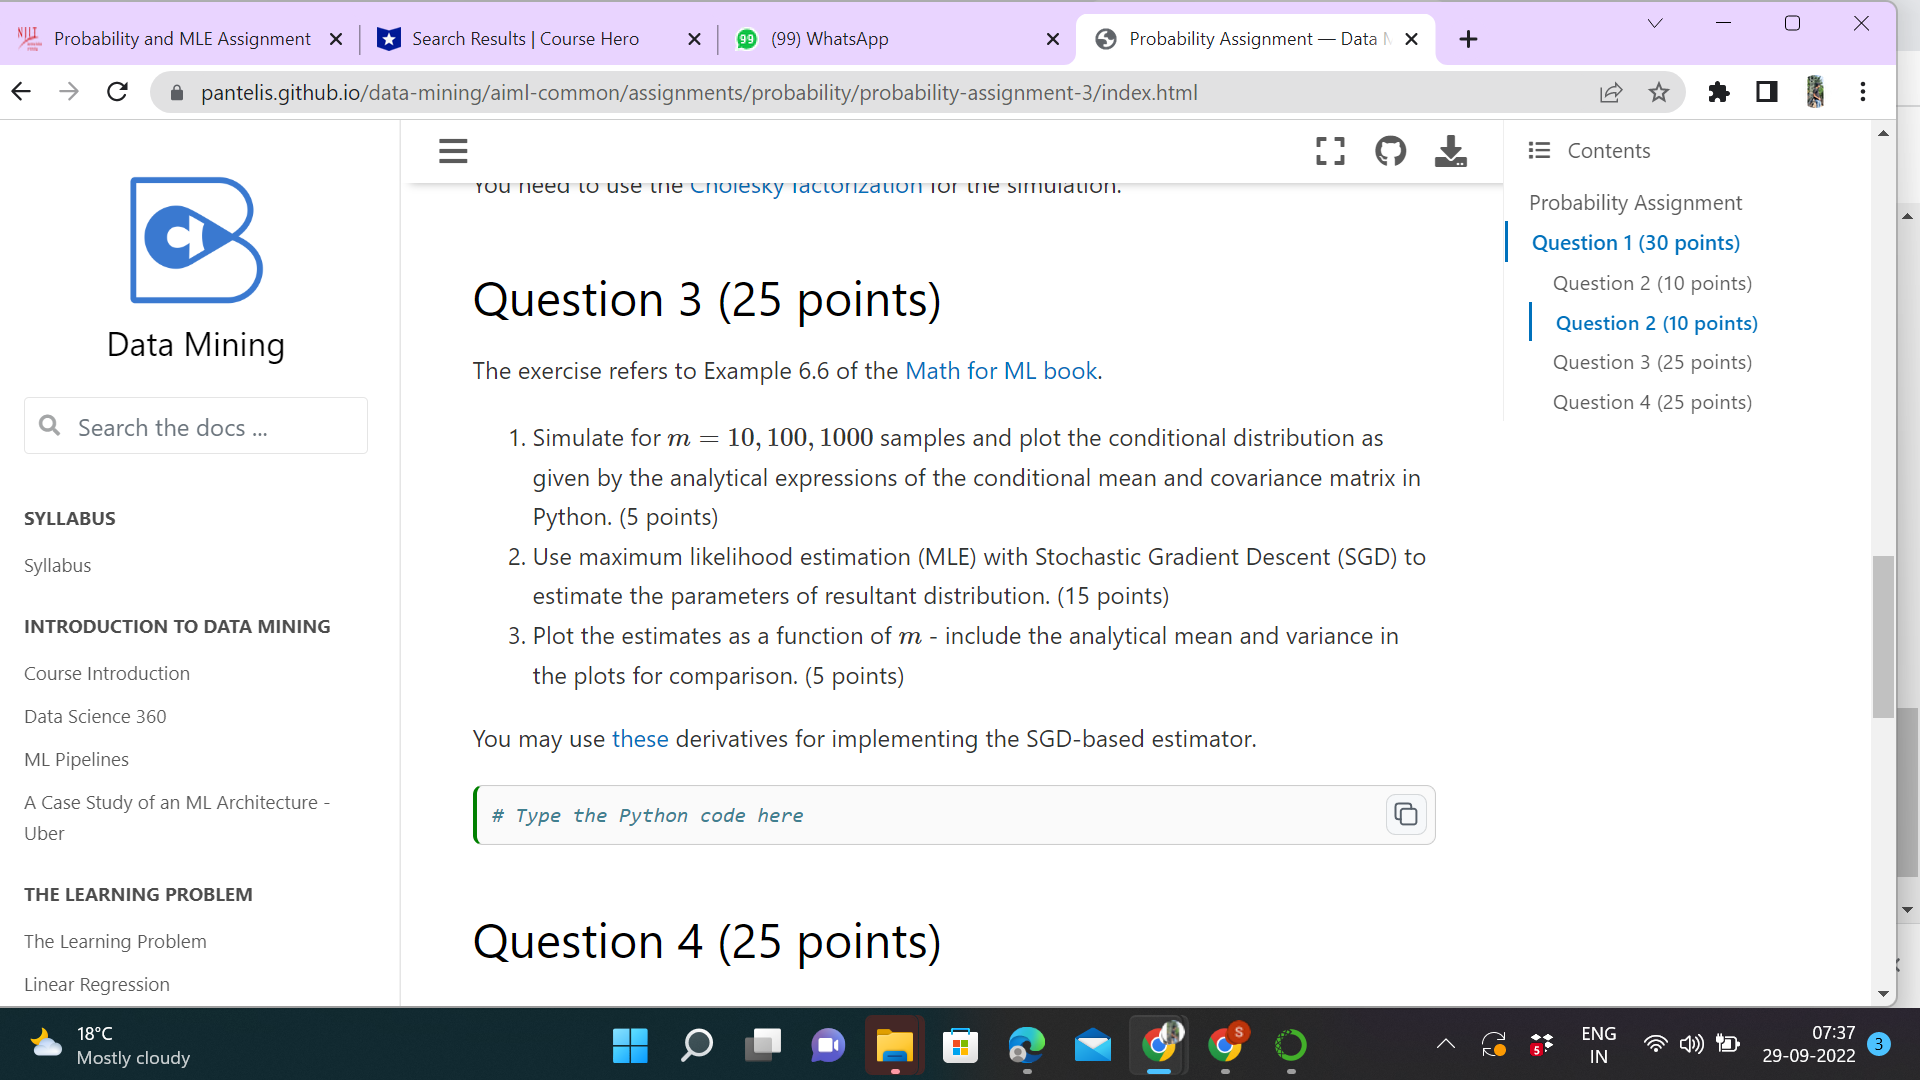
O X " Probability and MLE Assignment X Search Results | Course Hero X 99 (99) WhatsApp X Probability Assignment - Data MX + C a pantelis.github.io/data-mining/aiml-common/assignments/probability/probability-assignment-3/index.html E Contents you need to use the Criolesky Factorization TO The SITTIuIation. Probability Assignment Question 1 (30 points) Question 3 (25 points) Question 2 (10 points) Question 2 (10 points) Data Mining The exercise refers to Example 6.6 of the Math for ML book. Question 3 (25 points) Question 4 (25 points) Q Search the docs ... 1. Simulate for m = 10, 100, 1000 samples and plot the conditional distribution as given by the analytical expressions of the conditional mean and covariance matrix in SYLLABUS Python. (5 points) Syllabus 2. Use maximum likelihood estimation (MLE) with Stochastic Gradient Descent (SGD) to estimate the parameters of resultant distribution. (15 points) INTRODUCTION TO DATA MINING 3. Plot the estimates as a function of m - include the analytical mean and variance in Course Introduction the plots for comparison. (5 points) Data Science 360 You may use these derivatives for implementing the SGD-based estimator. ML Pipelines A Case Study of an ML Architecture - # Type the Python code here Uber THE LEARNING PROBLEM The Learning Problem Question 4 (25 points) Linear Regression 18.C ENG 07:37 Mostly cloudy O IN 29-09-2022 3
Step by Step Solution
There are 3 Steps involved in it

Get step-by-step solutions from verified subject matter experts