

Question: 3.What did you learn from the Capstone simulation? What were your firm's strengths and weaknesses from the above chart? What would you do differently if
3.What did you learn from the Capstone simulation? What were your firm's strengths and weaknesses from the above chart? What would you do differently if you played it again?
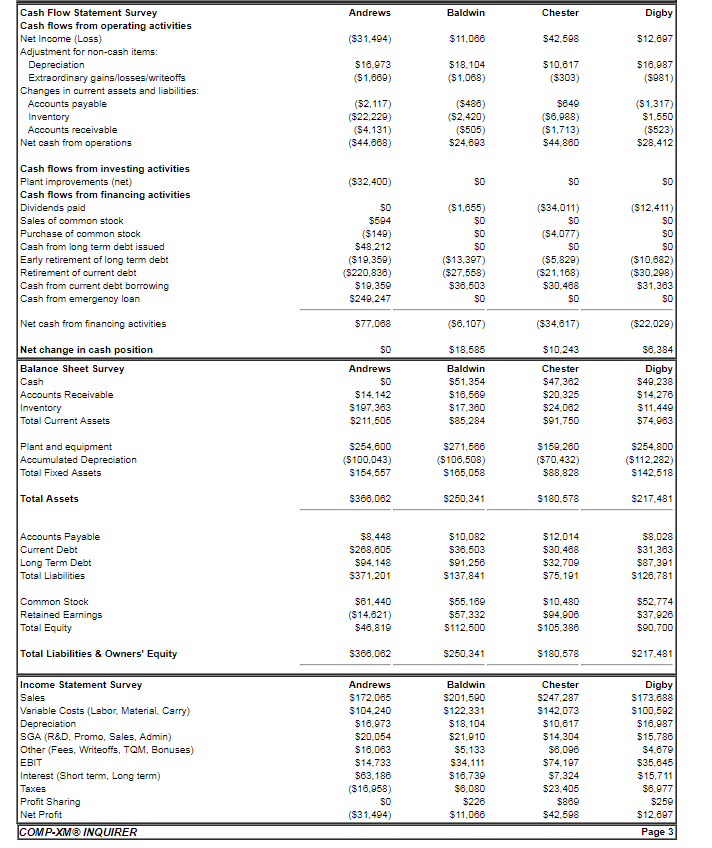
Cash Flow Statement Survey Cash flow Net Income (Loss) Adjustment for non-cash items: Baldwin s from operating activities 512,897 Extraordinsry ga Changes in current assets and liabilities: (52,420) Net cash from operations 524.683 544.880 Cash flows from investing activities Plant improvements (net) Cash flows from financing activities ($32,400) ($1,855) (S34,011) Sales of common stock Purchsse of common Cash from long term debt issued Early retirement of long term debt Retirement of current debt Cash from current debt borrowing Cash from emergency stock ($19,359) ($27,558) ($21,168) $249,247 Net cash from financing activities ($22,029) Net change in cash position $10.243 Baldwin 551,354 549,238 $14,142 197.383 520,325 524.062 514,276 574.963 254,800 $142,518 217.481 Total Current Assets 585,284 159,280 ($70,432) Plant and equi S271566 (5106,5038) $165,058 (5100,043) Total Fixed Assets Total Assets 388,062 250,341 Accounts Paysble Current Debt Long Term Debt Total Liabilities $12,014 594.148 $137,841 S128,781 $52,774 537.926 ($14,821) Total Equity Total Liabilities &Owners' Equity 250,341 5217.481 Baldwin S201,590 $122.331 518.104 247,287 $142,073 $173,888 100,502 Variable Costs (Labor, Material, Carry) Depreciation SGA (R&D, Promo, Sales, Admin) Other (Fees, Writeoffs, TOM, Bonuses) $104,240 520,054 $74.197 $23.405 542.508 535,845 Interest (Short term, Long term) ($18,958) Net Profit ($31,494) $12.887 COMP-XME INQUIRER Cash Flow Statement Survey Cash flow Net Income (Loss) Adjustment for non-cash items: Baldwin s from operating activities 512,897 Extraordinsry ga Changes in current assets and liabilities: (52,420) Net cash from operations 524.683 544.880 Cash flows from investing activities Plant improvements (net) Cash flows from financing activities ($32,400) ($1,855) (S34,011) Sales of common stock Purchsse of common Cash from long term debt issued Early retirement of long term debt Retirement of current debt Cash from current debt borrowing Cash from emergency stock ($19,359) ($27,558) ($21,168) $249,247 Net cash from financing activities ($22,029) Net change in cash position $10.243 Baldwin 551,354 549,238 $14,142 197.383 520,325 524.062 514,276 574.963 254,800 $142,518 217.481 Total Current Assets 585,284 159,280 ($70,432) Plant and equi S271566 (5106,5038) $165,058 (5100,043) Total Fixed Assets Total Assets 388,062 250,341 Accounts Paysble Current Debt Long Term Debt Total Liabilities $12,014 594.148 $137,841 S128,781 $52,774 537.926 ($14,821) Total Equity Total Liabilities &Owners' Equity 250,341 5217.481 Baldwin S201,590 $122.331 518.104 247,287 $142,073 $173,888 100,502 Variable Costs (Labor, Material, Carry) Depreciation SGA (R&D, Promo, Sales, Admin) Other (Fees, Writeoffs, TOM, Bonuses) $104,240 520,054 $74.197 $23.405 542.508 535,845 Interest (Short term, Long term) ($18,958) Net Profit ($31,494) $12.887 COMP-XME INQUIRER
Step by Step Solution
There are 3 Steps involved in it

Get step-by-step solutions from verified subject matter experts