

Question: 3.what does your r value tell you about the correlation of the variables? 4. Graph the regression line you found in 2), on the graph
3.what does your r value tell you about the correlation of the variables? 4. Graph the regression line you found in 2), on the graph in 1). 5. Use calculator to find the 2- variable statistics to the means and standard deviation of the variables in the data. Using those find (do those values look familiar?: b1= r sy/ax =And B2 = y-b1x =6. Use the regression line to predict the final course grade of a student who was absent for 7 days .
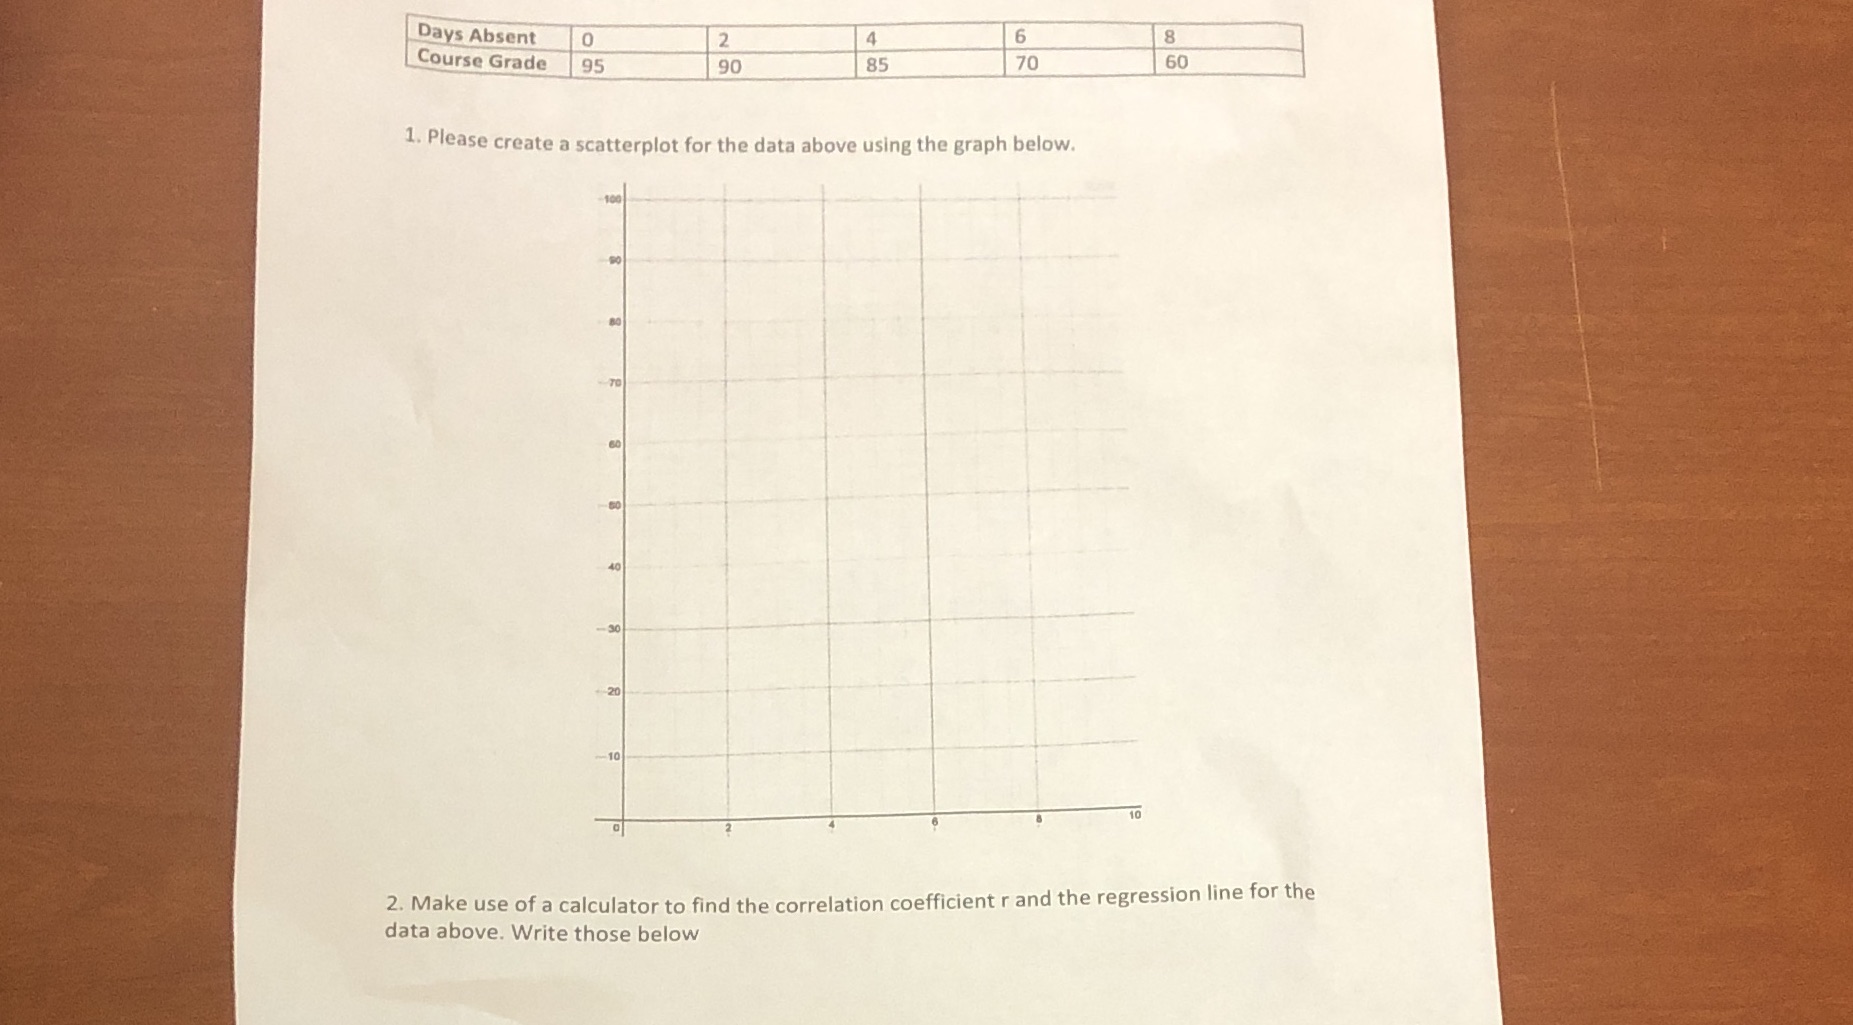
Days Absent 0 2 4 6 8 Course Grade 95 90 85 70 60 1. Please create a scatterplot for the data above using the graph below. 70 40 -30 20 10 2. Make use of a calculator to find the correlation coefficient r and the regression line for the data above. Write those below
Step by Step Solution
There are 3 Steps involved in it

Get step-by-step solutions from verified subject matter experts