

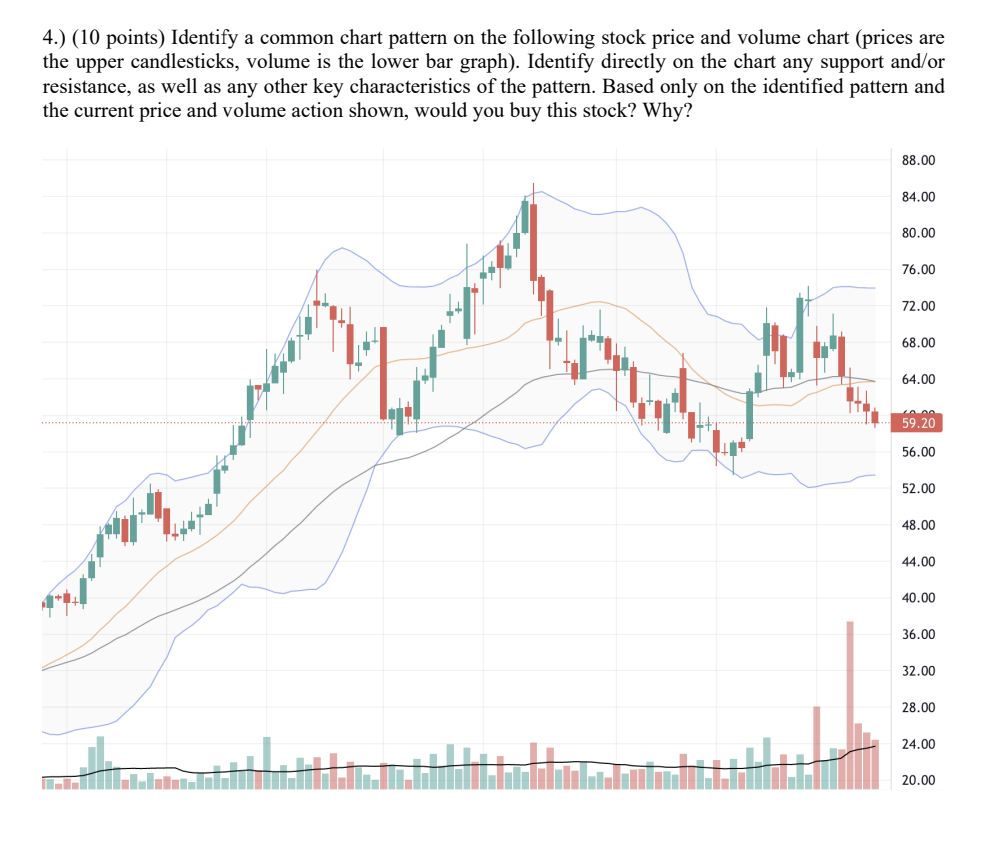
Question: 4 . ) ( 1 0 points ) Identify a common chart pattern on the following stock price and volume chart ( prices are the
points Identify a common chart pattern on the following stock price and volume chart prices are the upper candlesticks, volume is the lower bar graph Identify directly on the chart any support andor resistance, as well as any other key characteristics of the pattern. Based only on the identified pattern and the current price and volume action shown, would you buy this stock? Why?
Step by Step Solution
There are 3 Steps involved in it
1 Expert Approved Answer
Step: 1 Unlock

Question Has Been Solved by an Expert!
Get step-by-step solutions from verified subject matter experts
Step: 2 Unlock
Step: 3 Unlock